Mastering Linear Equations in Two Variables Questions on the SAT
Understanding linear equations in two variables is key to mastering the SAT math section. This guide breaks down techniques to solve these problems and provides complete examples to illustrate each solution.
Linear equations in two variables are a staple of the SAT math section. These equations not only test your algebraic skills but also your ability to interpret and represent real-world situations mathematically through word problems.
The key to solving these equations lies in understanding their graphical representation as straight lines, and the interplay between their coefficients and constants. Let's dive into the steps to solve these problems effectively.
Understanding the Equation Format
Standard Form
Linear equations in two variables are commonly presented in the standard form , where , , and are constants, and and are the variables.
This form is particularly useful for understanding the structural components of the equation. For instance, the values of and play a significant role in determining the slope and y-intercept of the graph of the equation.
Slope-intercept form
The slope-intercept form, another popular representation, is . In this format, represents the slope of the line, and is the y-intercept. This form is especially handy for graphing and interpreting linear equations quickly.
For example, if an equation is given as , it is immediately clear that the slope is 2 and the line crosses the y-axis at (0, 3).
Another important aspect is understanding how changes in the coefficients , , and affect the graph. For instance, increasing the value of in steepens the slope of the line, while changes in shift the line up or down without altering its slope. As an example, in the equation , doubling to 4 results in the new equation , which has a steeper slope.
Manipulating Equations
It's crucial to understand how to manipulate equations in both the standard linear equation and slope-intercept forms. For instance, converting from the standard form to the slope-intercept form involves solving for . This process includes rearranging the equation and isolating on one side.
For example, to convert to the slope-intercept form, you would first subtract from both sides to get , and then divide everything by 3, resulting in .
Word Problems
Finally, the ability to recognize and work with different forms of linear equations is fundamental to solving a variety of problems on the SAT. The exam often contains word problems that require converting and manipulating these equations to extract meaningful information.
For example, in a problem where the total cost of items is represented by a linear equation , where is the number of apples and is the number of oranges, understanding these equation formats allows you to determine individual item costs (apples cost 3 each and oranges cost 5 each).
Graphical Representation
Understanding the graph of a linear equation is crucial in visualizing the relationship between the variables. As introduced above, the slope-intercept form, , is particularly useful for this purpose. In this form, represents the slope of the line, indicating its steepness and direction, and is the y-intercept, showing where the line crosses the y-axis.
For example, consider the linear equation . This equation has a slope of 2, meaning the line rises two units vertically for every one unit it moves horizontally. The y-intercept is 3, so the line crosses the y-axis at the point (0, 3). Below is a graph illustrating this line:

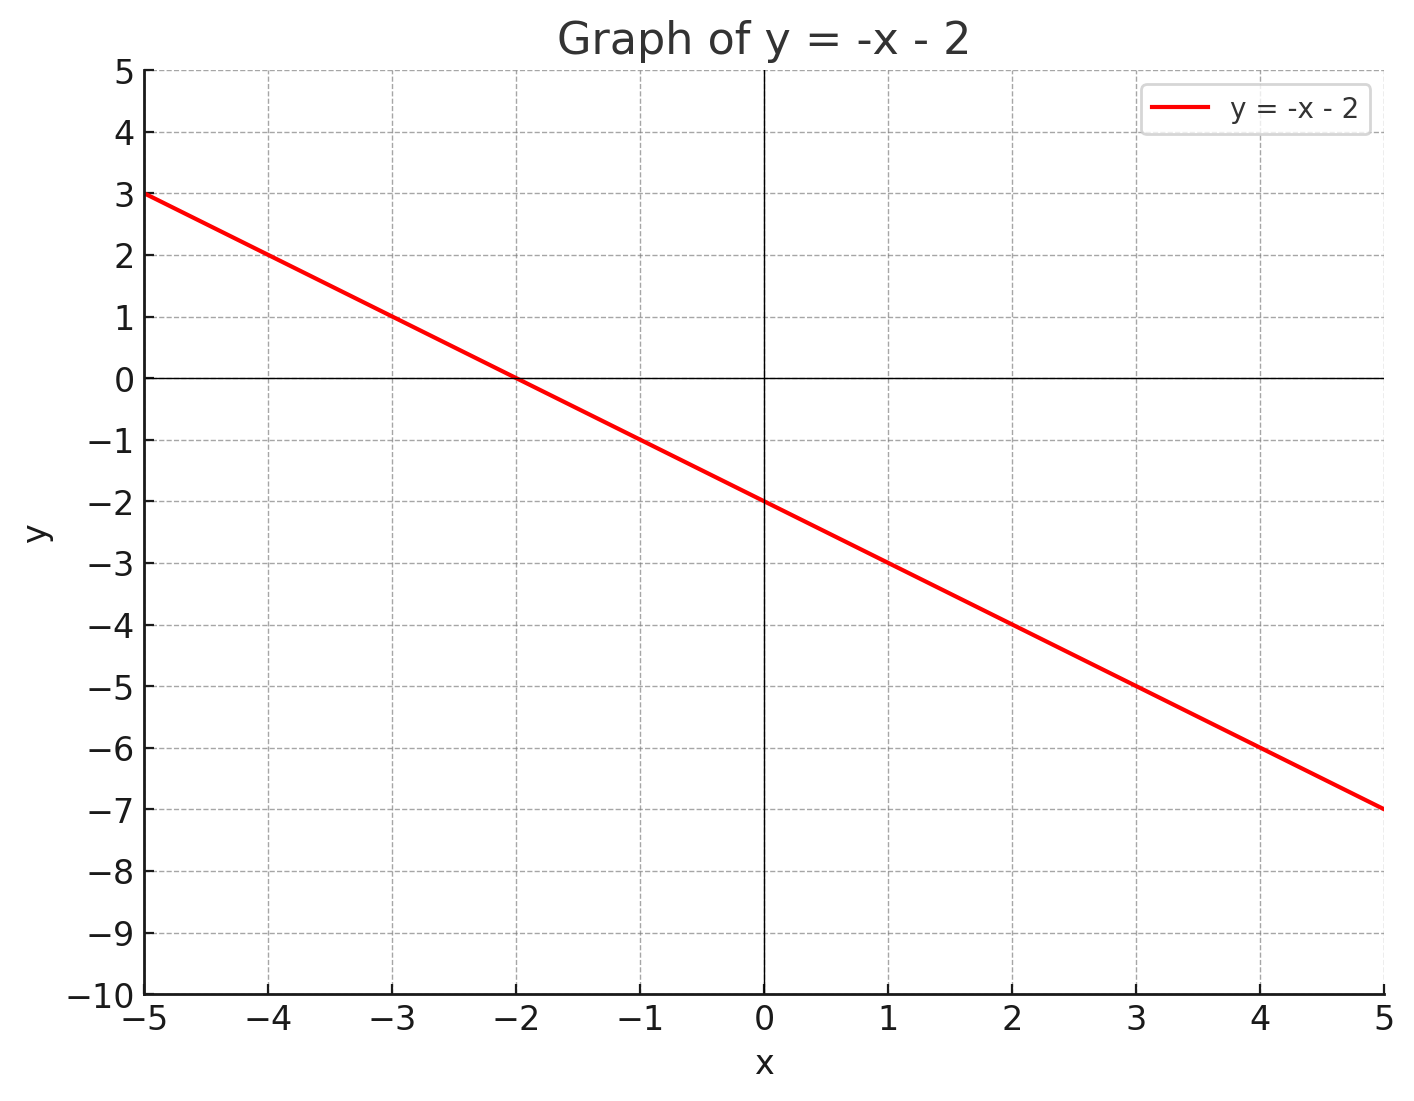
Conversely, a negative slope indicates a line that decreases as it moves from left to right. Take the equation as an example. Here, the slope is -1, and the y-intercept is -2, meaning the line crosses the y-axis at (0, -2). The following graph demonstrates this:

By examining these graphs, we can gain a deeper understanding of how linear equations represent various relationships. The intersection points, slopes, and intercepts all convey meaningful information about the relationships between the variables in word problems.
Solving the Equation
The most common linear question question on the SAT is solving the equation(s). Solving linear equations in two variables typically involves finding values of and that satisfy the equation. This can be done using various methods, such as graphing (discussed above), substitution, or elimination.
Substitution
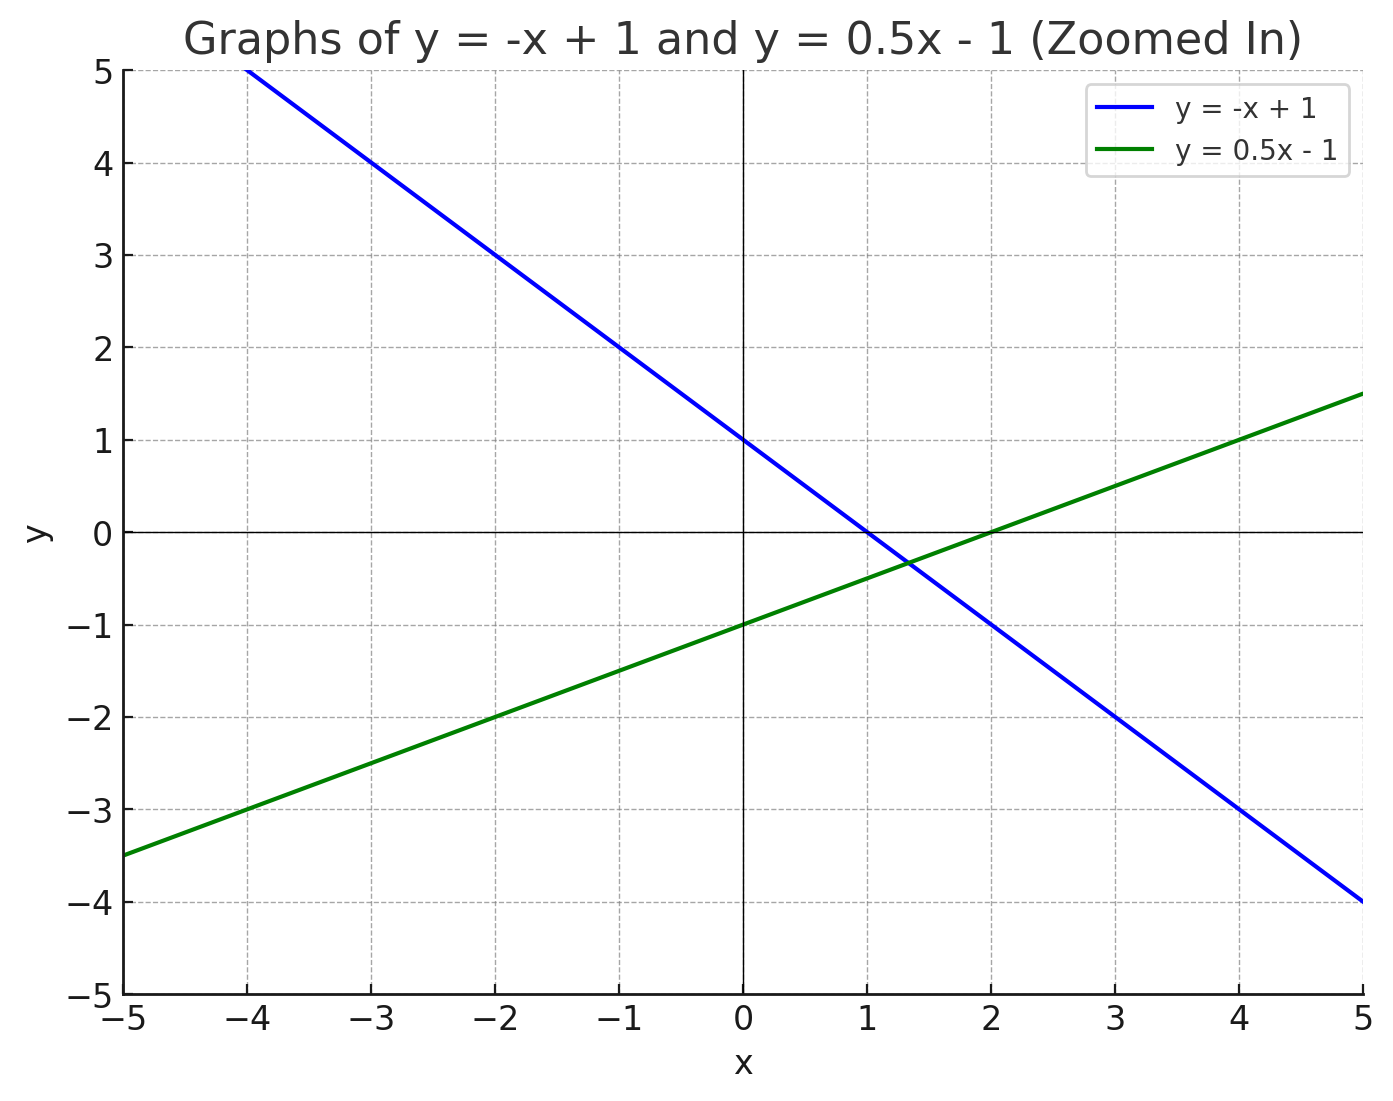
Consider the system of equations and . By graphing these two equations, you would find their point of intersection, which is the solution to the system.
Alternatively, you can use the substitution method. Since both equations are solved for , you can set them equal to each other: . Solving this equation for gives you one part of the solution, and substituting this value back into either of the original equations will give you the corresponding value.
Elimination
Another method is elimination, which is useful when the equations are in the standard form. Take the system and . By manipulating these equations (for example, multiplying the second equation by 3), you can eliminate one of the variables when you add or subtract the equations from each other.
This method leads to finding the value of one variable, and subsequently, the other variable can be found by back-substitution.
Special Case 1: No Solution
Additionally, it's important to consider special cases. For instance, if the solution results in a contradiction like , it indicates that the system of equations has no solution.
Despite the equations not having any solutions, this case is frequently a valid answer choice on mulitple-choice math questions on the SAT.
Special Case 2: Infinitely Many Solutions
If the checking process results in a always-true statement like for every variable value, it implies that the system has infinitely many solutions, and just like no solutions, infinitey many solutions is also a valid answer choice on the exam.
Checking Your Solution
Substituting Solutions Back Into Equations
If time allows, always check your solutions. For linear equations, you can substitute your found values back into the original equations to ensure they satisfy all given conditions. This step confirms the accuracy of your solution and helps identify any possible calculation errors.
For instance, consider the solution for the system of equations and . To check the solution, substitute and into both equations. The first equation becomes , which simplifies to 6, matching the right side of the equation. Similarly, the second equation becomes , which simplifies to -2, but does not match the right side of the equation, indicating an error in the solution.
Checking Using Graphs
Another method of checking involves graphing both equations and observing if the solution corresponds to the point of intersection. For linear equations, this graphical check can be quite effective, especially for visual learners.
In the above example, graphing both equations would show whether the point (1, 3) lies at the intersection of both lines.
Example Problems
Here are 3 complete examples that illustrate the methods discussed above.
Example 1: Substitution Method
Problem: Solve the system of equations: and .
Solution:
- Set Equations Equal: Since both equations equal , set them equal to each other: .
- Solve for x: Subtract from both sides: . Then, subtract 1 from both sides: .
- Find y: Substitute into one of the original equations: , so .
- Solution: The solution is .
Example 2: Elimination Method
Problem: Solve the system of equations: and .
Solution:
- Add Equations: Adding the equations cancels : , simplifying to .
- Solve for x: Divide both sides by 9: .
- Find y: Substitute into one of the original equations: , simplifying to . Subtract 6 from both sides: , so .
- Solution: The solution is .
Example 3: Graphical Method
Problem: Find the point of intersection for the lines and .
Solution:
- Graph Both Equations: Draw each line on a coordinate plane.

- Identify Intersection: Look for the point where both lines cross.
- Solution: By looking at the graph, you'll find the lines intersect at .
Now that you've mastered this question type, it's time to test your skills
Take a Free Digital SAT Practice Test