GRE Data Interpretation Questions: Complete Guide & Practice
Data Interpretation (DI) is a distinct question format within the GRE Quantitative Reasoning measure. Unlike standalone problems that present all the information you need in the question itself, DI questions appear in sets of 2 to 5 questions that all reference the same shared data display — a table, graph, chart, or combination of these. The data display stays on screen while you work through each question in the set, and the individual questions can draw on any of the four GRE math domains: Arithmetic, Algebra, Data Analysis, or Geometry.
This guide covers everything you need to know about the DI format: what makes these questions unique, which math domains appear most often, a step-by-step solving framework, two fully worked examples, six interactive practice questions from the question bank, common traps to avoid, and a study checklist to track your preparation.
What Are Data Interpretation Questions?
Data Interpretation questions are a unique format within the GRE Quantitative Reasoning measure. Rather than presenting a single self-contained problem, DI questions group 2 to 5 questions around a shared data display that remains visible on your screen as you work through the set. The data display can be a table with rows and columns of numbers, a bar graph comparing categories over time, a line graph showing trends, a circle (pie) chart dividing a total into parts, a boxplot, a scatterplot, a histogram, or even a combination of two displays such as a table paired with a graph.
Within a single DI set, the individual questions can be any of the four standard GRE quantitative question types. The table below summarizes each type and how it appears within a DI set.
Question Types Within DI Sets
Question Type
How It Appears in DI Sets
Multiple Choice — Select One
5 answer choices (A through E), select exactly 1
Multiple Choice — Select One or More
Variable number of choices with square checkboxes, select all that apply
Numeric Entry
Type your answer as an integer, decimal, or fraction
Quantitative Comparison
Compare Quantity A vs. Quantity B using data from the display
A single DI set may contain a mix of these question types. For example, a set of 4 questions based on a bar graph might include two select-one multiple choice questions, one numeric entry question, and one select-one-or-more question. This variety means you need to be comfortable with all four question formats before tackling DI sets.
4 Math Domains in DI
Data Interpretation questions can draw on skills from all four GRE mathematical domains. Understanding how each domain appears within DI sets helps you recognize the required approach more quickly during the test. The table below summarizes the frequency and typical question patterns for each domain.
Domain Frequency in DI Questions
Domain
Frequency
Typical Question Patterns
Arithmetic
Very Common
Percent change, ratios from tables, proportions, averages
Data Analysis
Very Common
Reading graphs, computing statistics, probability from data displays
Algebra
Occasional
Setting up equations from data, solving for unknowns
Geometry
Rare
Circle graph sector calculations, proportional reasoning
How to Solve Step by Step
DI questions reward a systematic reading approach. Work through each step below to learn the seven-step framework — answer each mini-challenge to unlock the next step.
Interactive Walkthrough0/7 steps
The 7-Step DI Framework
Every Data Interpretation set begins with one or more data displays (tables, graphs, or charts) followed by 2–3 questions. The framework below teaches you how to approach any DI set systematically.
Work through each step to build the habit. Each challenge tests a common trap or skill.
1
Step 1: Read the Title, Labels, and Units
A graph axis says "Revenue (in billions of dollars)" and a bar reaches the "5" line. What value does that bar represent?
2
Step 2: Note Footnotes and Special Conditions
3
Step 3: Understand Multiple Displays
4
Step 4: Re-Read the Question Wording
5
Step 5: Let Answer Choices Guide Precision
6
Step 6: Track Units Through Calculations
7
Step 7: Manage Time Across the Set
Worked Example 1: Table-Based Percent Calculation
Work through each step below. You must answer each mini-challenge correctly to unlock the next step. A second wrong attempt will reveal the answer automatically.
Number of Employees by Department and Employment Type at Company X
Department
Full-Time
Part-Time
Total
Marketing
45
12
57
Engineering
120
8
128
Sales
60
30
90
Human Resources
15
5
20
Total
240
55
295
Interactive Walkthrough0/5 steps
Percent-of-Total from a Data Table
The number of part-time employees in the Sales department is what percent of the total number of employees at Company X? 5.1% 10.2% 18.6% 33.3% 54.5%
1
Step 1: Find the numerator
Which value from the table is the numerator — the number we're expressing as a percent?
2
Step 2: Identify the denominator
3
Step 3: Compute the percent
4
Step 4: Understand the 33.3% trap
5
Step 5: Understand the 54.5% trap
Worked Example 2: Table-Based Mean Calculation
This example teaches the arithmetic mean workflow: sum the values, divide by the count, round to the required precision, and verify units. Work through each step to build the habit.
Monthly Revenue (in thousands of dollars) for Store Y, January through June
Month
Jan
Feb
Mar
Apr
May
Jun
Revenue ($K)
$20
$25
$30
$22
$35
$40
Interactive Walkthrough0/6 steps
Arithmetic Mean from a Time-Series Table
What is the average (arithmetic mean) monthly revenue, in thousands of dollars, for Store Y for the months shown? Give your answer to the nearest thousand.
1
Step 1: Recall the formula
Arithmetic mean = ?
2
Step 2: Sum all monthly revenues
3
Step 3: Count the data points
4
Step 4: Compute the mean
5
Step 5: Round to the nearest thousand
6
Step 6: Verify units
Practice Questions
Test your skills with these six questions drawn from different math domains and data display types. Each question includes a data context, step-by-step solution, and a key insight. Select your answer, then click “Check Answer” to see the full explanation.
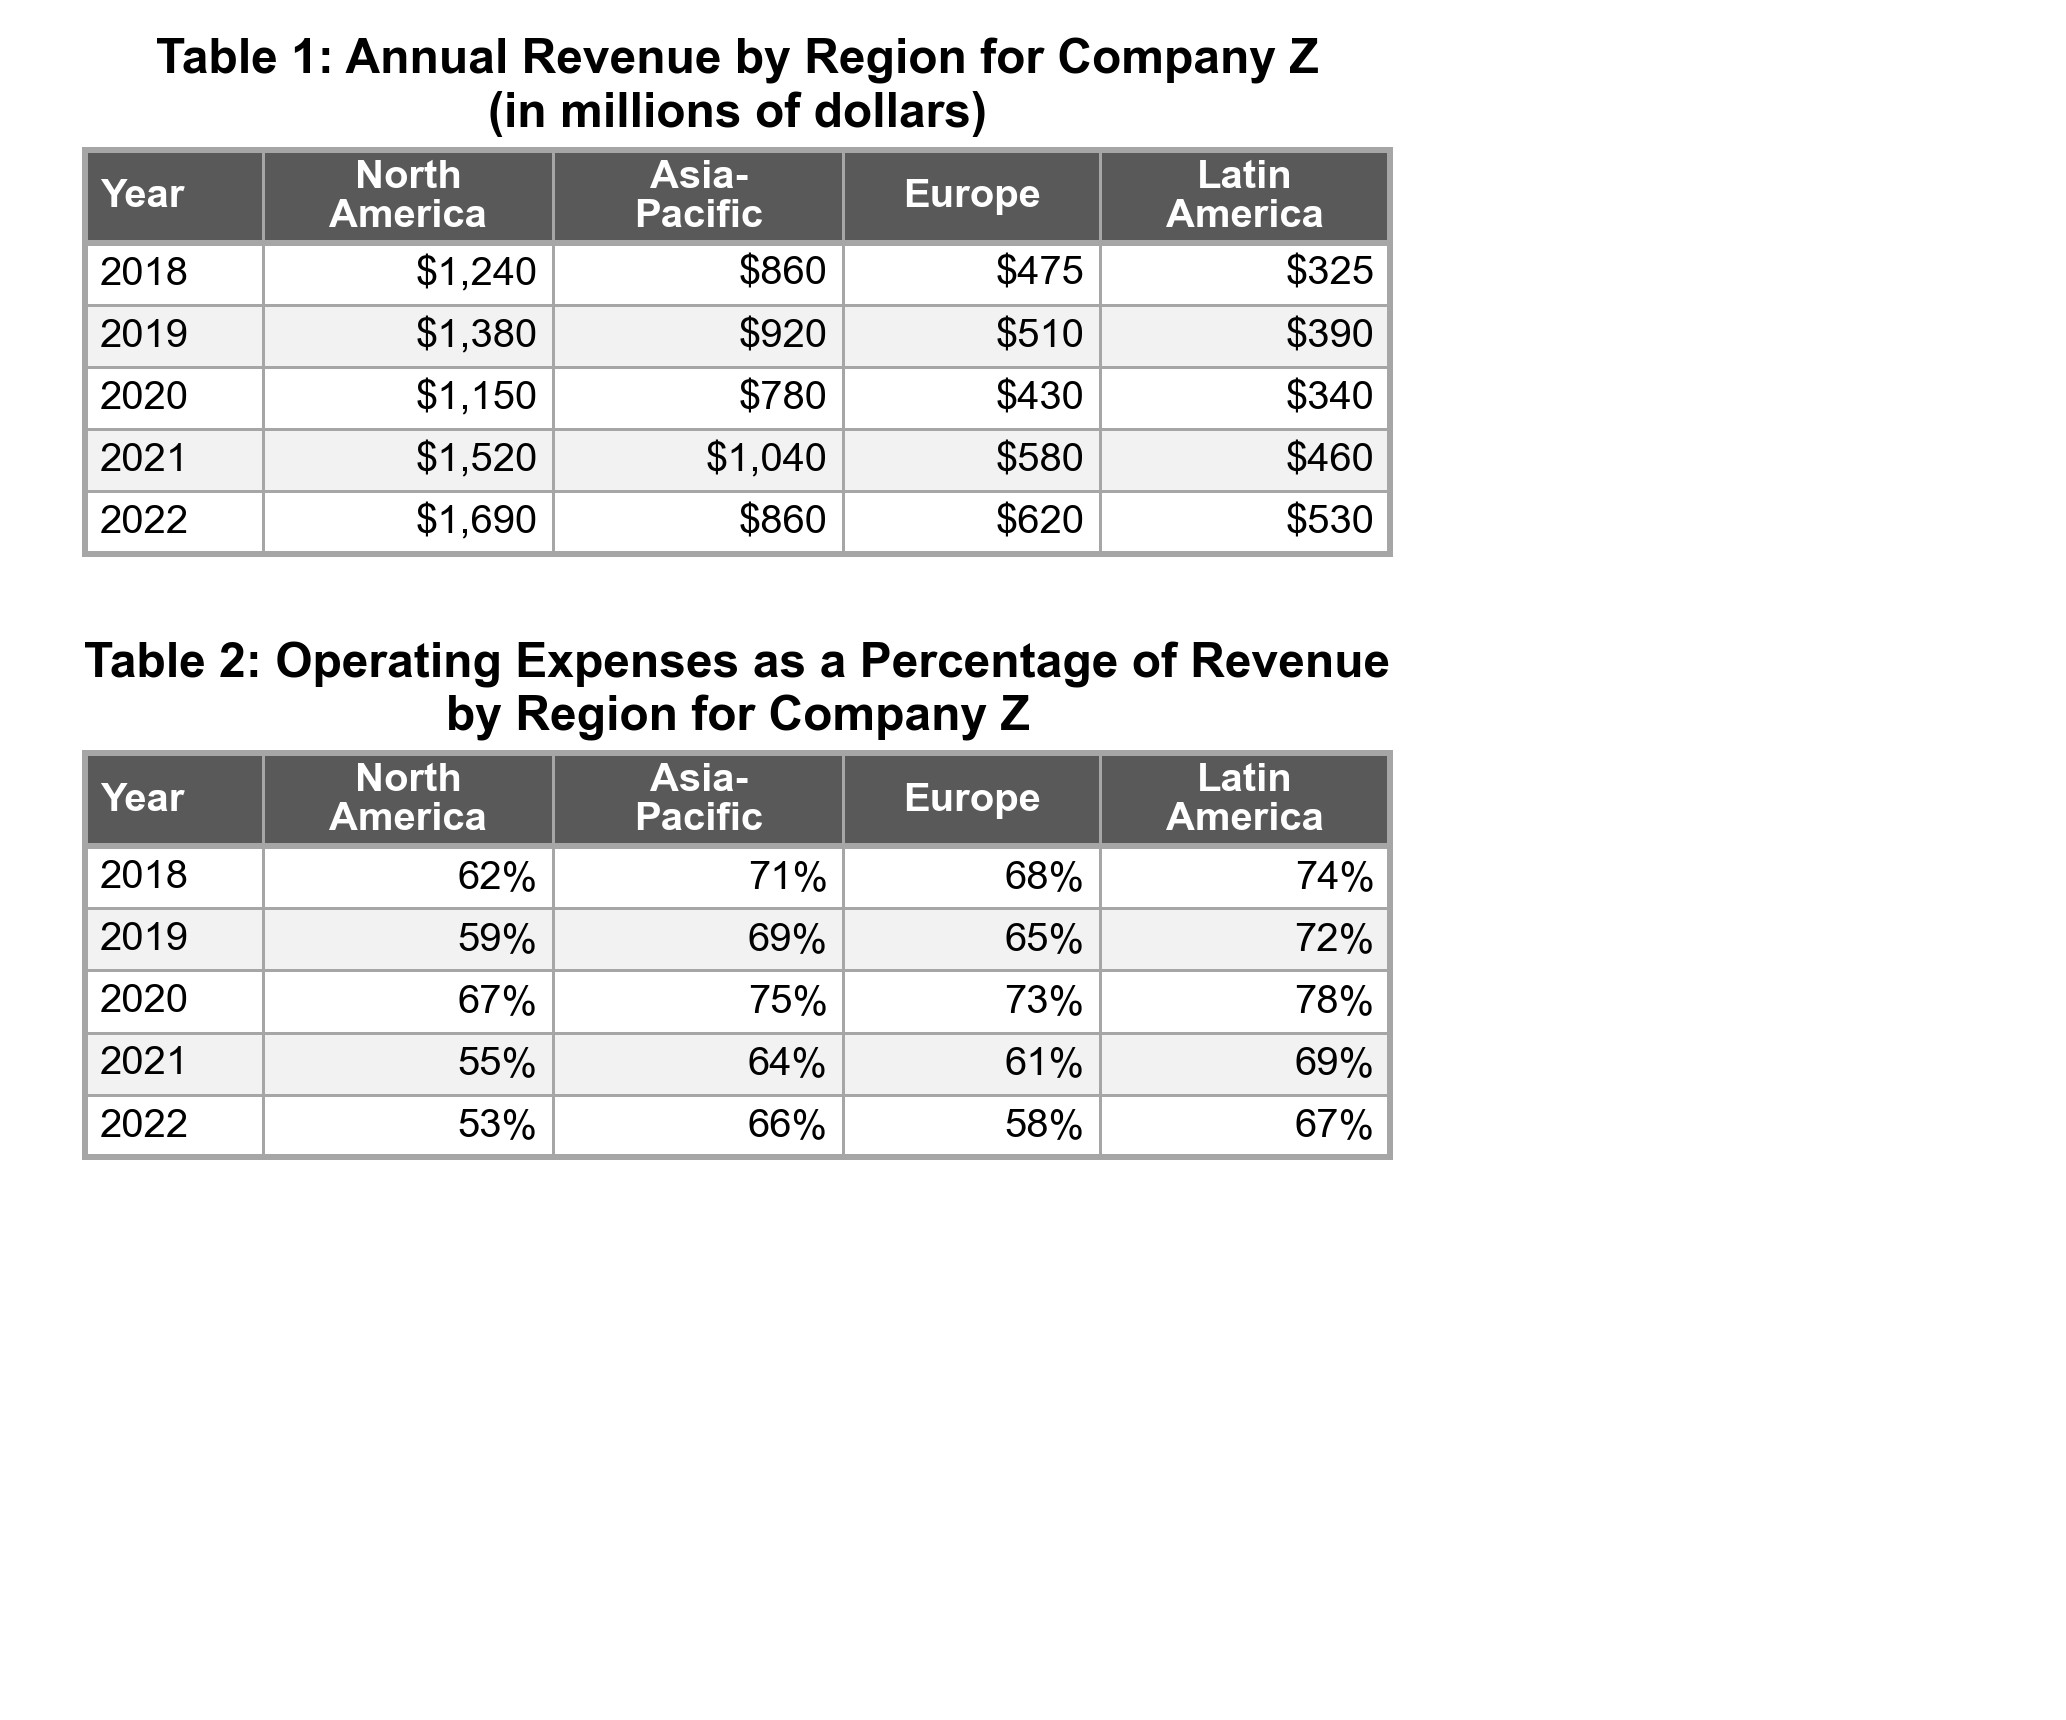
For which region did the operating expense ratio decrease by the greatest number of percentage points from 2018 to 2022?
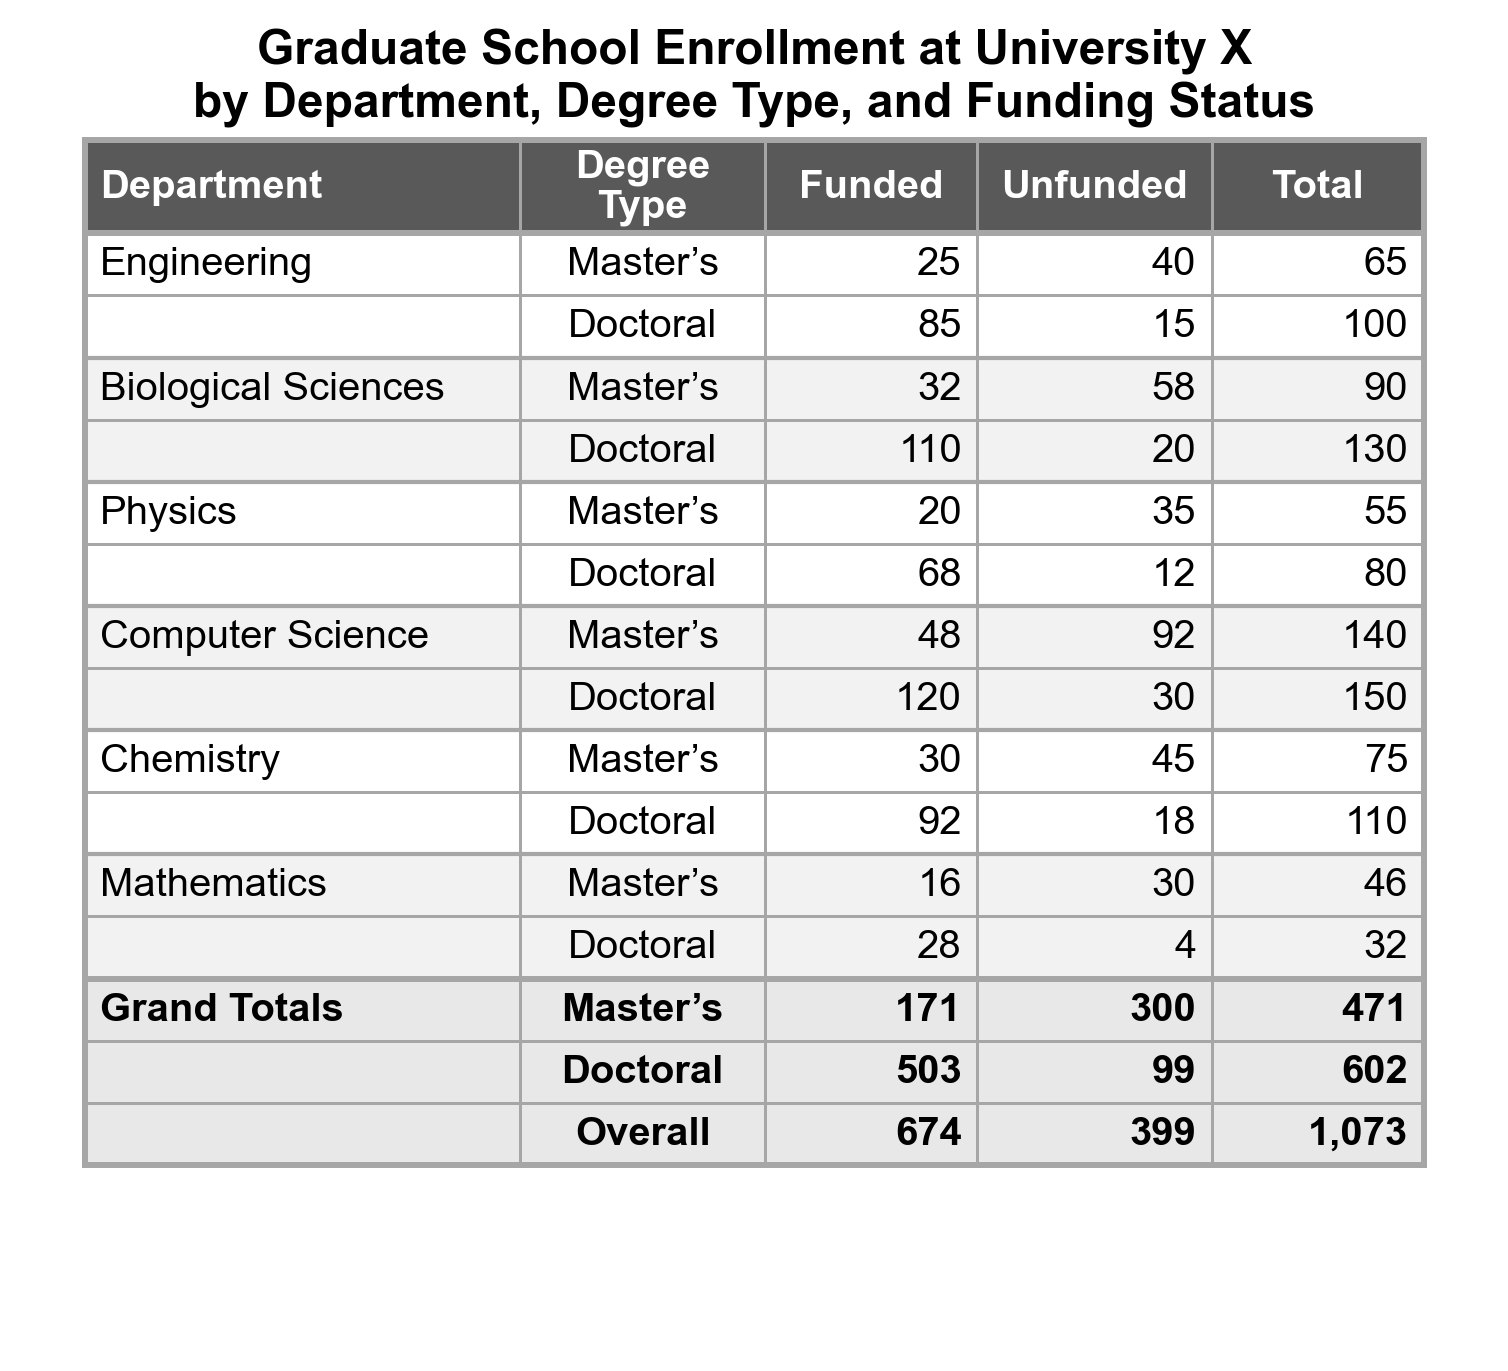
For which department is the ratio of funded Doctoral students to unfunded Doctoral students the greatest?
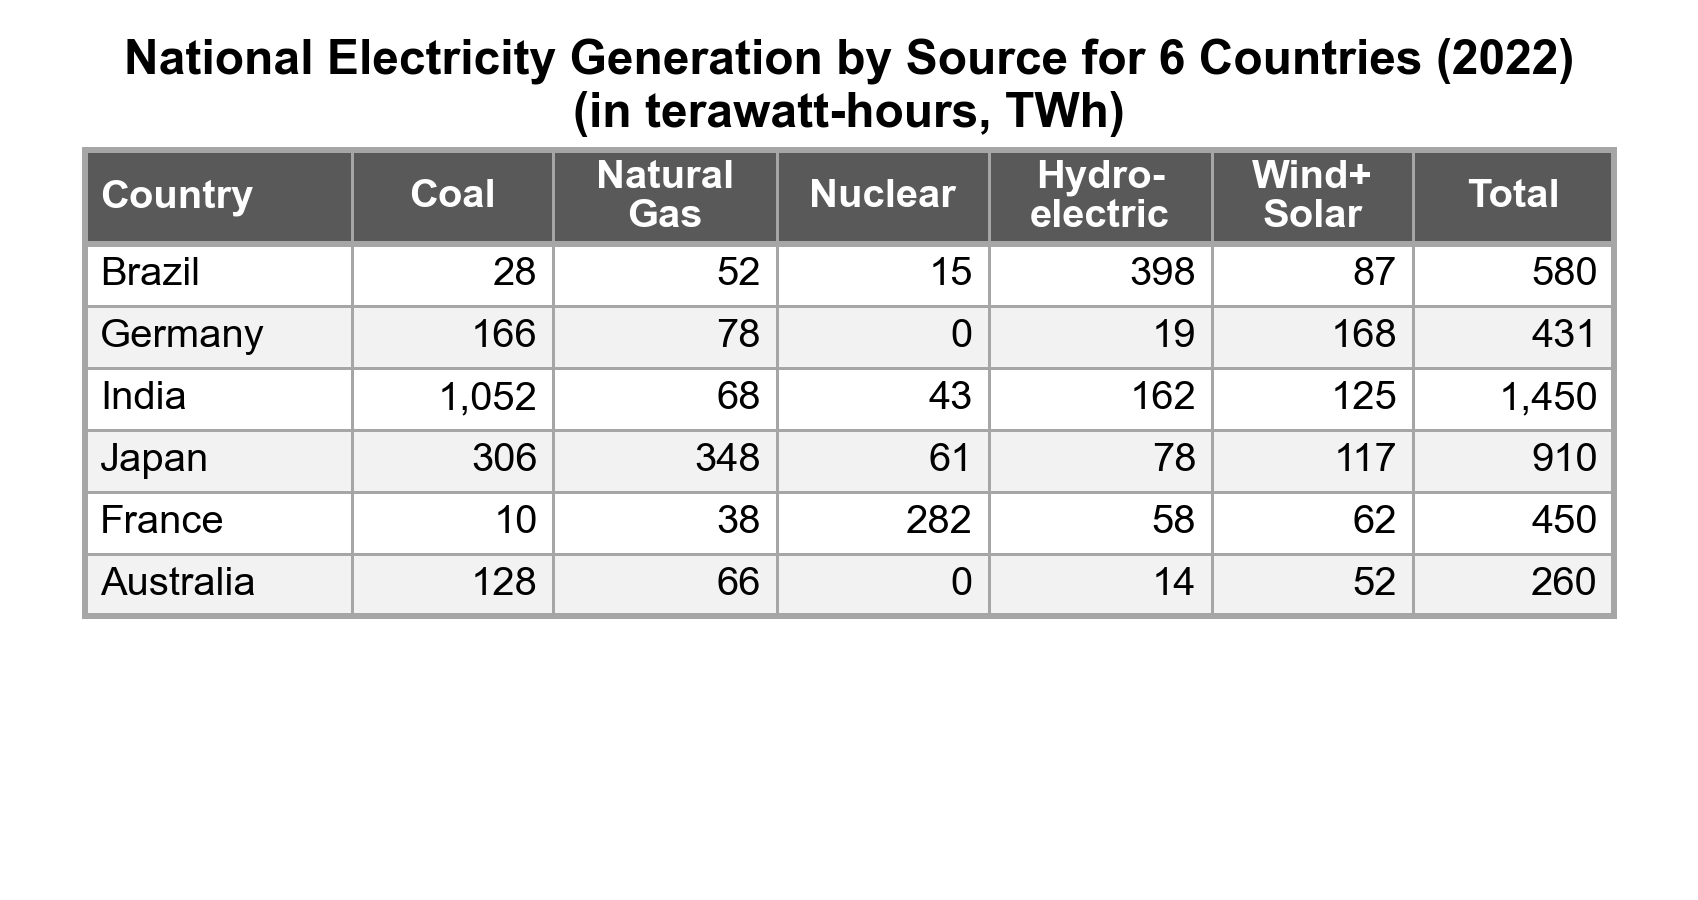
Across all six countries combined, non-fossil-fuel sources (Nuclear, Hydroelectric, and Wind+Solar) generated approximately what percent of total electricity?
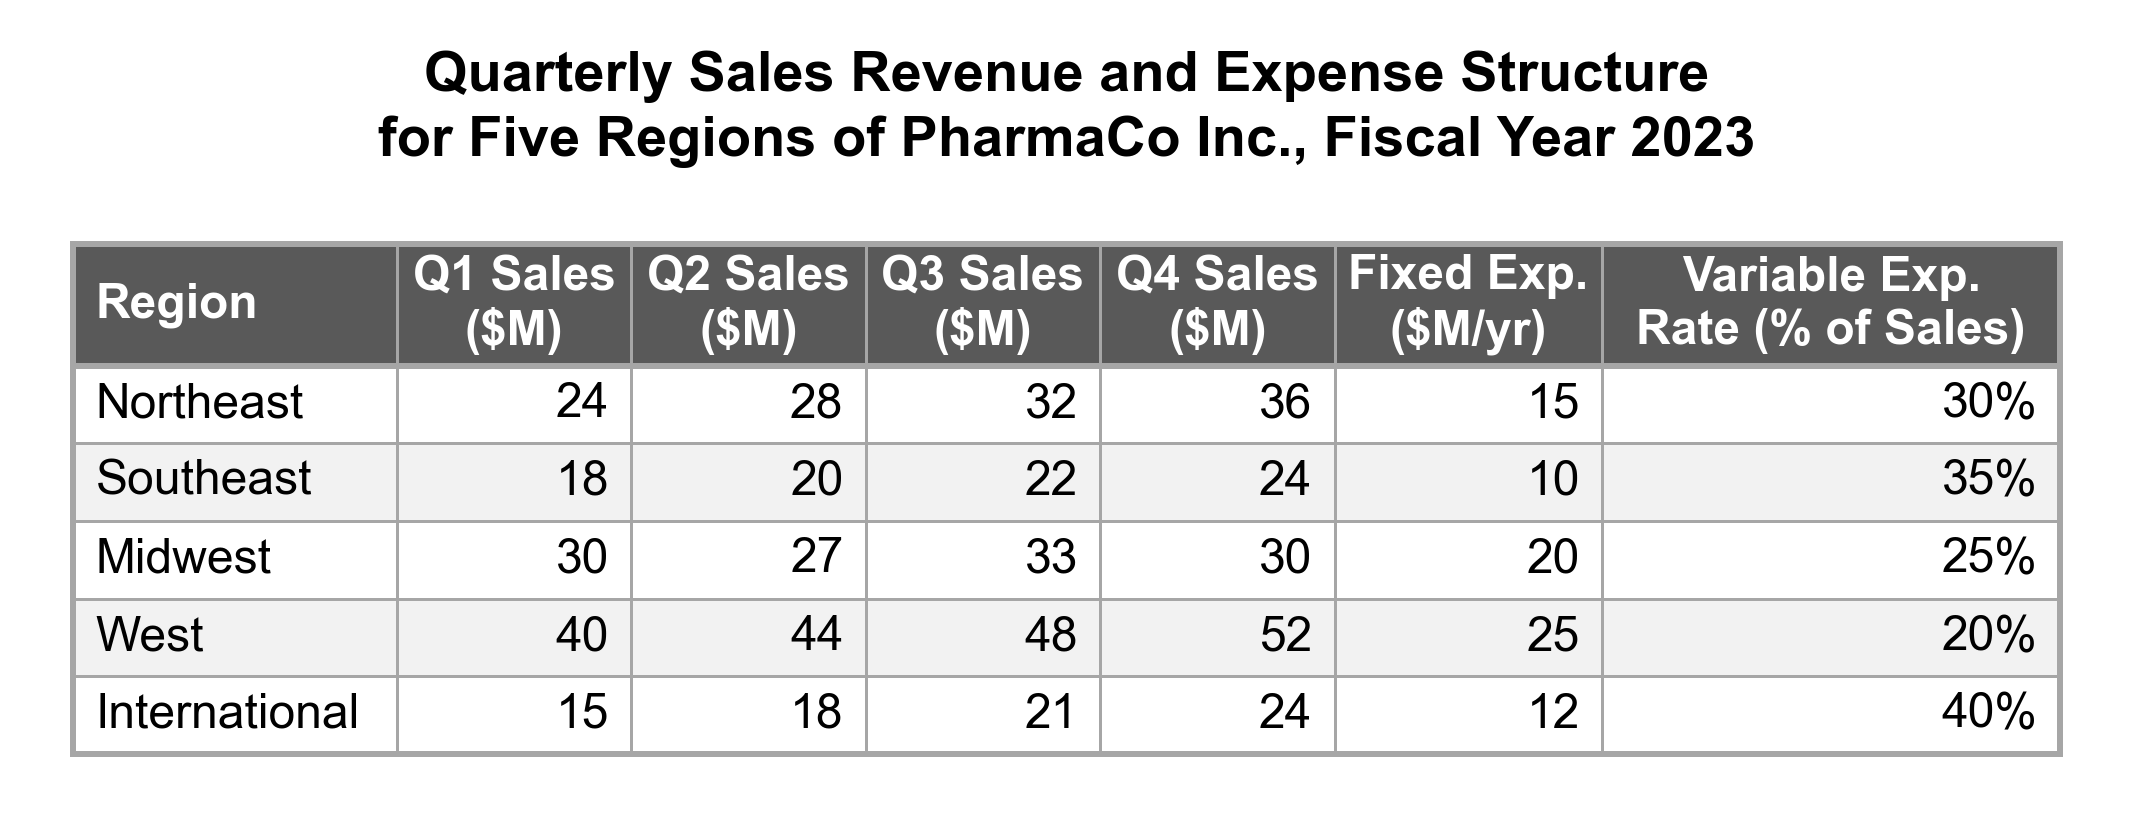
The Northeast region's quarterly sales increased at a constant rate from Q1 through Q4 of fiscal year 2023. If this linear trend continued at the same constant quarterly rate, what would the projected sales be for Q2 of fiscal year 2024, in millions of dollars?
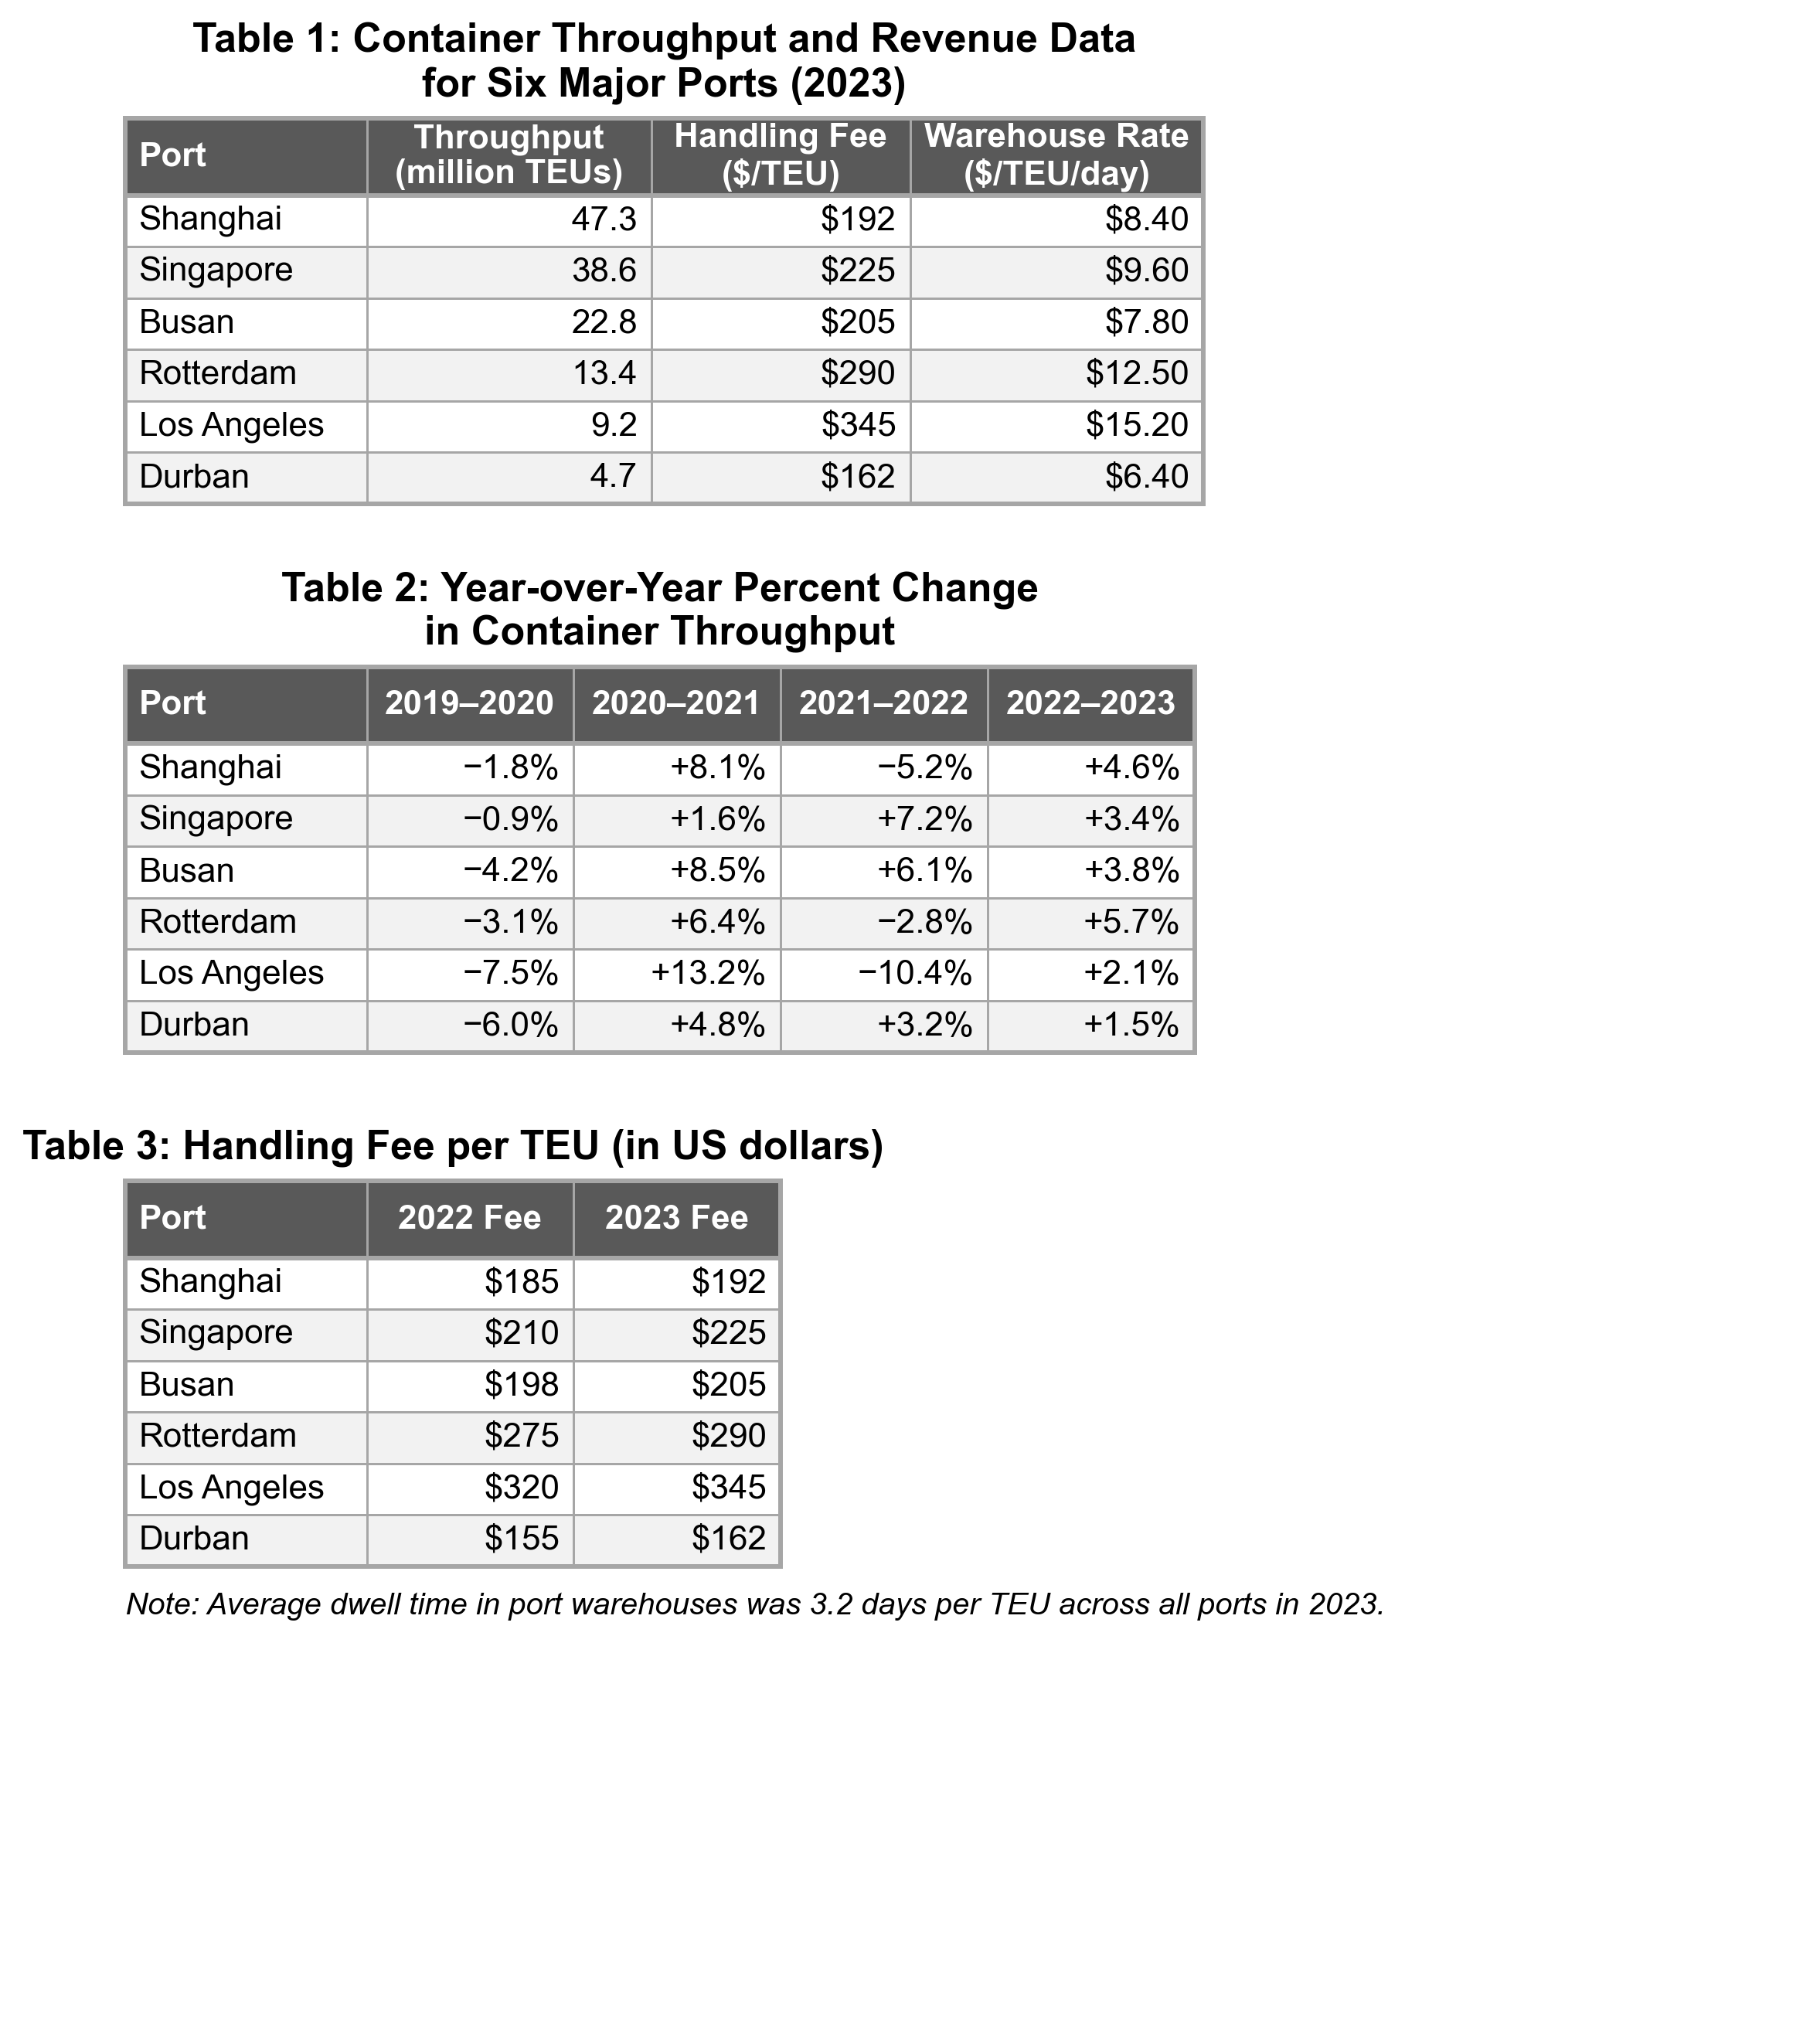
The total handling revenue (throughput multiplied by handling fee per TEU) generated by Singapore in 2023 was approximately how many million dollars greater than the total handling revenue generated by Busan in 2023?
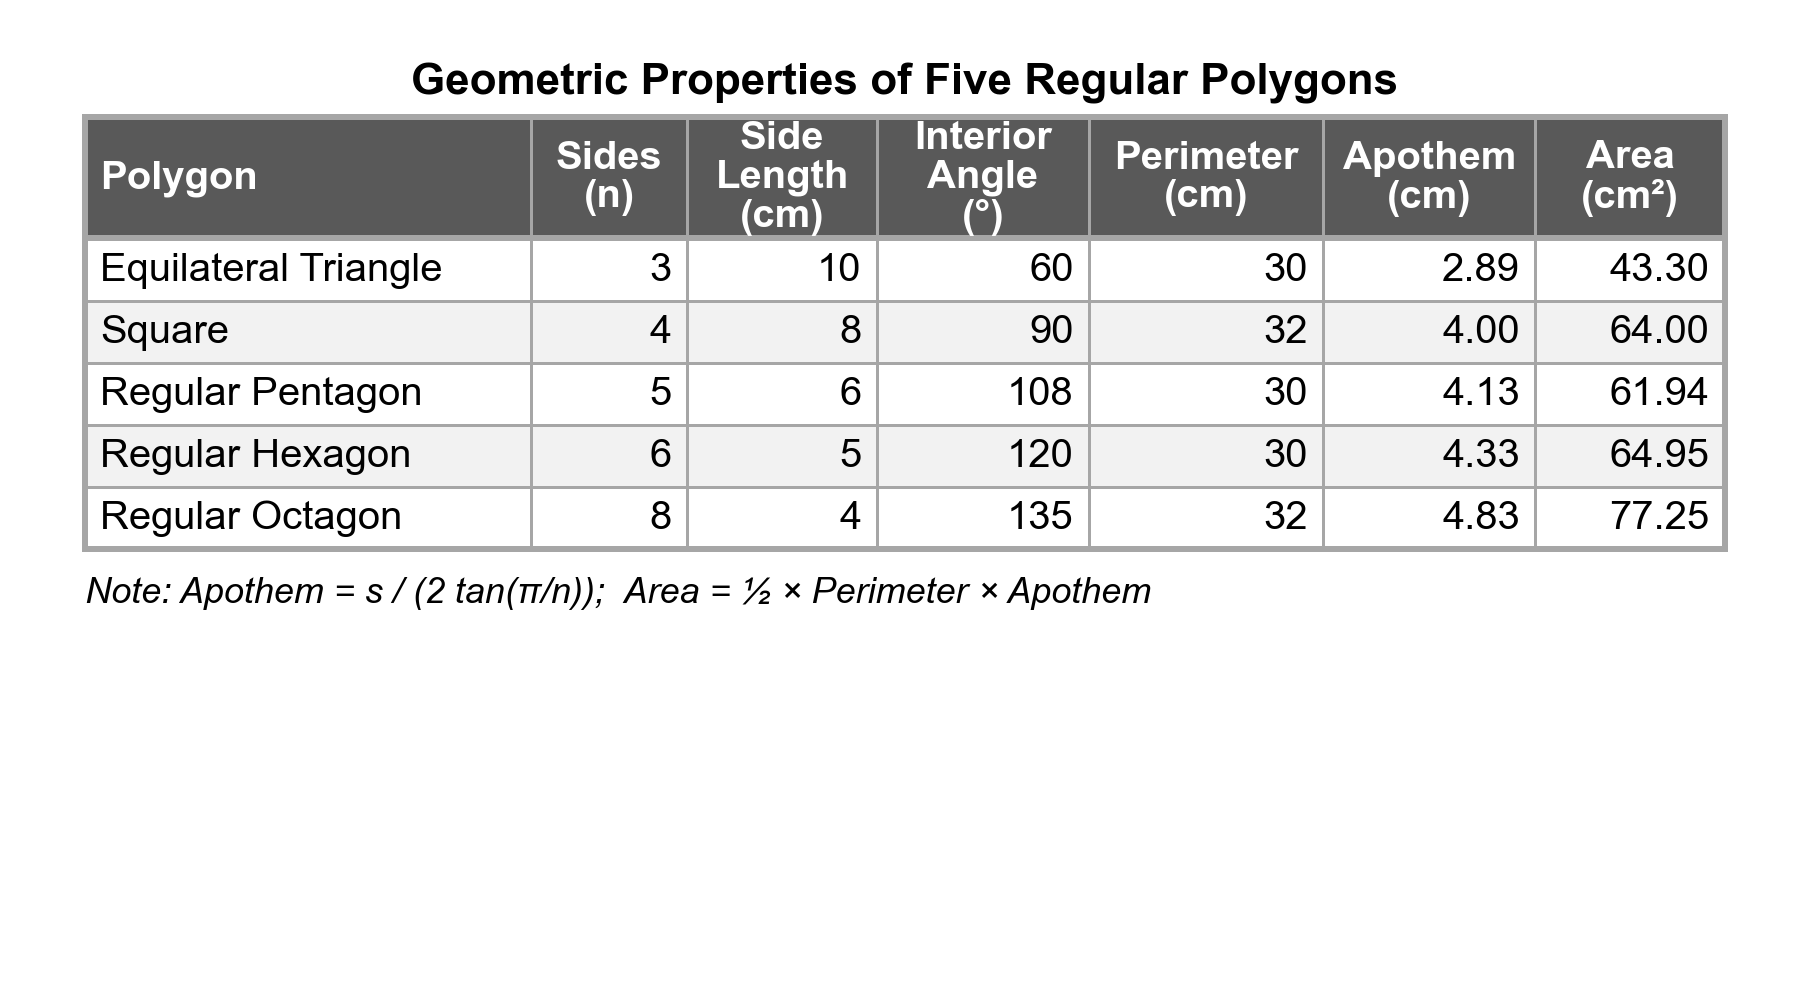
The sum of the interior angles of the regular octagon exceeds the sum of the interior angles of the square by how many degrees?
Common Traps
Wrong answer choices in DI questions are not random — they are specifically engineered to catch common misreadings and calculation errors. Recognizing these traps in advance makes you far less likely to fall for them on test day. Here are the three most frequent traps.
Study Checklist
Use this checklist to track your preparation for GRE Data Interpretation questions. Check off each skill as you master it.
0 / 8 completed
Frequently Asked Questions
How many Data Interpretation questions appear on the GRE?
Each Quantitative Reasoning section on the GRE typically includes one DI set containing 2 to 5 questions. Since the test has two scored Quantitative sections, you can expect roughly 4 to 10 DI questions in total. These questions share a common data display such as a table, graph, or chart. The data display remains visible on screen as you answer each question in the set, so you only need to read and understand it once.
What types of data displays appear in GRE Data Interpretation sets?
GRE DI sets use tables, bar graphs (simple, grouped, or stacked), line graphs, circle (pie) graphs, boxplots, scatterplots, histograms, and frequency distributions. Some sets combine two or more displays, such as a table alongside a graph or two tables that share the same row and column categories. The data display is designed to contain more information than any single question requires, so selective reading is essential to avoid wasting time on irrelevant data.
What math skills are tested in GRE Data Interpretation questions?
DI questions draw from all four GRE math domains: Arithmetic (percents, ratios, averages, percent change, compound percent change), Algebra (setting up equations from data, solving for unknowns, linear extrapolation), Data Analysis (mean, median, probability, distributions, weighted averages), and occasionally Geometry (circle graph sector calculations, interior angle sums from tables). The majority of DI questions emphasize Arithmetic and Data Analysis skills, but the hardest questions often require algebraic reasoning.
How much time should I spend on each Data Interpretation question?
Budget approximately 2 minutes per DI question, including the upfront time you spend reading and understanding the data display. Because all questions in a set share the same display, the initial investment in understanding the data pays off across every question in the set. If a particular question is taking too long, mark it and move on to the others in the set — they may be easier and use data you have already studied. You can return to the marked question if time permits.
What is the most common mistake on GRE Data Interpretation questions?
The most common mistake is misreading the scale or units of the data display. For example, if a graph axis is labeled “Revenue (in billions of dollars),” a bar reaching 5 means $5 billion, not $5. Other frequent errors include using the wrong denominator for percent calculations, confusing “percent of” with “percent greater than,” reading the wrong row or column in a table, and forgetting to approximate when the question says “approximately.” Always check axis labels, column headers, and footnotes before answering any question in the set.