GRE Numeric Entry Data Analysis: Strategies and Practice
Numeric Entry questions in the Data Analysis domain are among the most demanding on the GRE. There are no answer choices to lean on — you must compute an exact value and type it into a blank box. The topics span frequency distribution means, standard deviation relationships, probability with combinations, weighted averages, interquartile ranges, and percent calculations from data displays. Below you will learn the six question patterns the GRE uses, work through two interactive examples step by step, and then practice with six guided questions drawn from an audited question bank.
What Are Numeric Entry Data Analysis Questions?
Numeric Entry questions require you to compute an exact value and type it directly into a blank box on screen. There are no answer choices to eliminate. You see either a single empty box for integers and decimals, or two stacked boxes with a fraction bar for fraction answers. The GRE accepts equivalent forms: 44.5 and 44.50 are both correct, and fractions do not need to be reduced.
When these questions fall in the Data Analysis domain, they test topics such as computing means from frequency distributions, applying standard deviation relationships, calculating probabilities with combinations, finding weighted averages from multi-group data, determining interquartile ranges, and extracting percent calculations from tables and graphs.
Critical detail: If the question specifies a rounding instruction such as "to the nearest 0.01" or "to the nearest whole percent," you must follow it exactly. Entering 1.3 when the answer is 1.29 (rounded to the nearest 0.01) will be marked wrong, even though 1.3 is close. Compute the exact answer first, then round as the very last step.
Six Question Patterns You Will See
Nearly every Numeric Entry Data Analysis question on the GRE falls into one of six patterns. Recognizing the pattern tells you which formula to set up and what data to extract.
1
Frequency Distribution Mean
You are given a table of values and their frequencies. Compute the mean as the sum of (value times frequency) divided by the total frequency, then round if instructed.
2
Value at a Given Standard Deviation
Given the mean and standard deviation, find the value that is k standard deviations above or below the mean. Apply the formula: value=μ+kσ (or minus for below).
3
Solving for Mean and Standard Deviation
Two values are described in terms of how many standard deviations they are from the mean. Set up two equations and solve the system to find μ and σ.
4
Average from Total and Count
A data table provides total revenue, total units, or similar aggregates. Compute the average by dividing the total by the count. The challenge is extracting the right numbers.
5
Counting with Combinations
Count subsets satisfying a condition, often using complementary counting. Total subsets minus those that fail the condition equals the answer.
6
Probability and Conditional Probability
Compute a probability using counting principles, Bayes' theorem, or inclusion-exclusion. The answer may be entered as a fraction or a decimal rounded to a specified precision.
How to Solve NE Data Analysis Step by Step
These six strategies apply across all the question patterns above. Follow them in order to minimize errors on a question format that gives you no choices to fall back on.
Before touching your scratch paper, confirm you are reading the correct row, column, or data point. On tables, trace across the row with your finger. On graphs, check the axis labels and scale. Misreading a single value from a data display is the most common source of wrong answers on Data Interpretation Numeric Entry questions.
For means, write: mean=countsum. For percentages, write: percent=wholepart×100. For standard deviation problems, write the relationship between μ, σ, and the given values. A clear formula prevents computational errors and makes your work easy to check.
Compute the exact answer first, then round at the very end. Do not round intermediate values. Rounding too early introduces error that compounds through subsequent calculations and can shift your final answer by just enough to be wrong.
For counting problems, it is often easier to count what you do not want and subtract from the total. For example, "subsets where the product is even" equals total subsets minus "subsets where all elements are odd." This avoids tedious case-by-case enumeration.
When a question says "X was what percent of Y," the setup is (X / Y) * 100. When it says "X percent of the total was used for Z," you need to compute X% of a given total first. Read the phrasing precisely — the denominator matters.
If a question asks "what percent" and your answer is 0.32, you likely forgot to multiply by 100. If it asks for a count and your answer is a fraction, something went wrong. Use the context to verify your answer is reasonable before submitting.
Pro tip: On Numeric Entry questions, there is no partial credit and no answer choices to eliminate. A small arithmetic error gives you zero points. Double-check every calculation, especially division and rounding, before you submit.
Worked Example: Median from a Frequency Table
Work through each step below. You must answer each mini-challenge correctly to unlock the next step. If you get stuck, a second wrong attempt will reveal the answer so you can keep going.
Interactive Walkthrough0/5 steps
Finding the Median of a Frequency Distribution
A teacher records the number of absences for 50 students during a semester. The results are shown below.
For n=50 data values (even count), the median is the average of which two positions when the data is ordered?
2
Step 2: Build cumulative frequencies
3
Step 3: Locate the 25th value
4
Step 4: Locate the 26th value
5
Step 5: Compute the median
Worked Example: Interquartile Range from Ordered Data
This example teaches you to compute the interquartile range — a measure of spread that the GRE frequently tests. Work through each step to master the process of splitting data, finding quartiles, and subtracting.
Interactive Walkthrough0/4 steps
Computing the Interquartile Range
An ordered data set contains 12 values:
3, 5, 7, 10, 12, 15, 18, 21, 24, 28, 33, 39
What is the interquartile range (IQR) of the data set?
1
Step 1: Split the data into lower and upper halves
With 12 values, each half contains how many values?
2
Step 2: Find Q1 (the first quartile)
3
Step 3: Find Q3 (the third quartile)
4
Step 4: Compute the IQR
Practice Questions
Now apply what you learned. Each question below is presented in multiple-choice format with five plausible choices (the correct answer plus four distractors). After you submit, click through the solution walkthrough one step at a time to compare against your own work.
Question 1 — Interquartile Range
The scores of 15 students on an exam are listed in ascending order: 52, 58, 61, 65, 68, 70, 72, 75, 78, 80, 84, 87, 90, 93, 97. What is the interquartile range of these scores?
Your Answer:
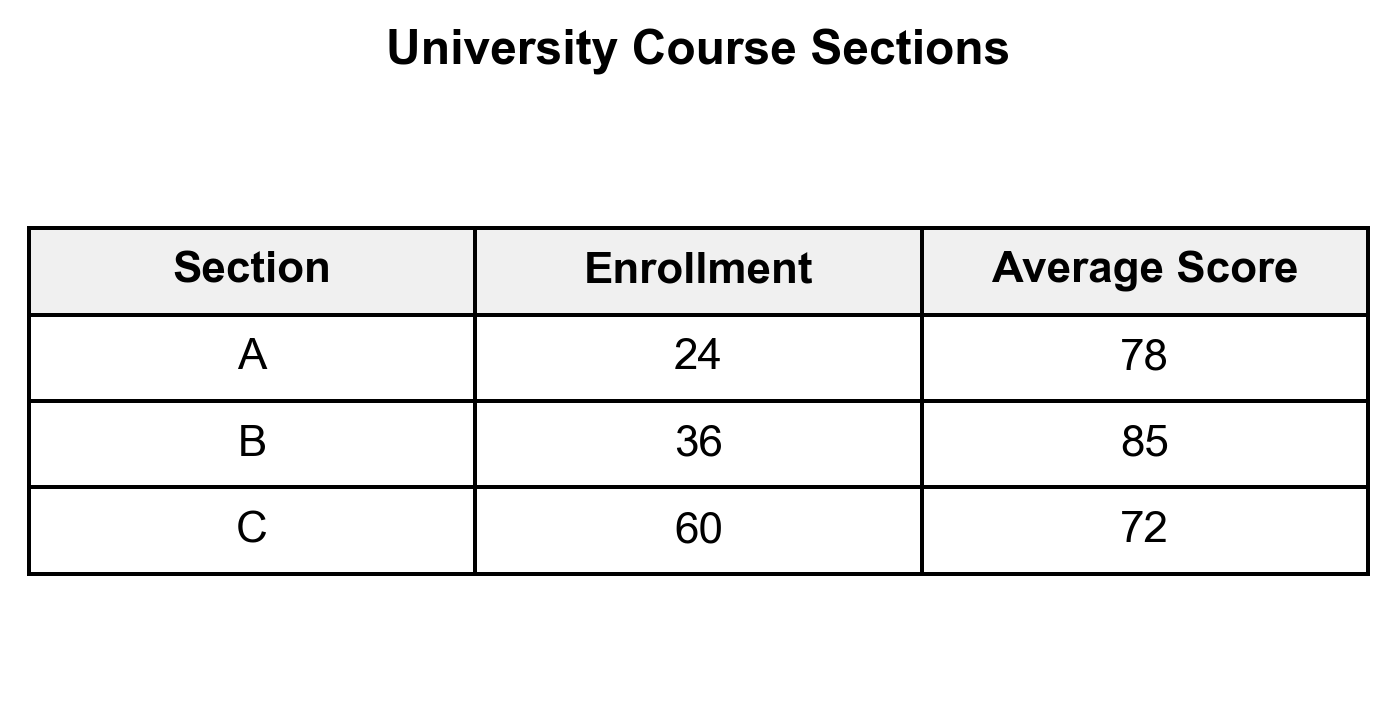
Question 2 — Weighted Average
Three sections of a university course have the following enrollment and average exam scores. Section A: 24 students, average 78. Section B: 36 students, average 85. Section C: 60 students, average 72. What is the weighted average exam score across all three sections? Give your answer to the nearest 0.1.
Your Answer:
Question 3 — Probability with Combinations
A bag contains 5 red marbles, 4 blue marbles, and 3 green marbles. If 3 marbles are drawn at random without replacement, what is the probability that all 3 marbles are the same color? Give your answer as a fraction (e.g., 0.0682 for 3/44).
Your Answer:
Question 4 — Percent Increase from Data
A company's quarterly revenue (in millions) over two years is shown below. Year 1: Q1 = 12.4, Q2 = 15.8, Q3 = 18.2, Q4 = 13.6 Year 2: Q1 = 14.8, Q2 = 19.0, Q3 = 21.6, Q4 = 16.6 The company's total revenue increased by what percent from Year 1 to Year 2? Give your answer to the nearest whole percent.
Your Answer:
Question 5 — Conditional Probability (Bayes' Theorem)
A quality control inspector examines items from two machines. Machine X produces 60% of items with a 3% defect rate. Machine Y produces 40% of items with a 7% defect rate. If an item is selected at random and found to be defective, what is the probability it was produced by Machine Y? Give your answer to the nearest 0.01.
Your Answer:
Question 6 — Finding a Missing Value, Then the Median
A data set has 10 values. Nine of the values are: 3, 5, 7, 8, 10, 12, 14, 16, 20. If the mean of all 10 values is 11.5, what is the median of all 10 values?
Your Answer:
Common Traps to Avoid
Trap
What Goes Wrong
Entering a decimal for a percent
The question asks 'what percent' and you enter 0.53 instead of 53.
Rounding too early
Rounding an intermediate calculation, then using the rounded value in further steps, producing a slightly wrong final answer.
Misreading the data display
Reading the wrong bar, row, or column from a graph or table. Trace with your finger to confirm.
Confusing 'percent of X' with 'percent of Y'
'Ethanol was what percent of non-export production' uses a different denominator than 'what percent of total production.'
Counting errors in combinatorics
Miscounting the number of odd or even elements in a set, or applying the wrong combination formula.
Standard deviation direction
Confusing '1.3 SDs below the mean' with '1.3 SDs above the mean' flips the sign in your equation.
The biggest trap of all: On Numeric Entry questions, there are no answer choices to sanity-check against. Every trap above becomes more dangerous because you cannot notice that your answer does not match any listed option. Build the habit of verifying your answer against the context of the problem before you submit.
Answer Format and Entry Rules
Understanding how the GRE handles Numeric Entry submissions can prevent unnecessary errors. Here are the rules you need to know.
Rule
Details
Equivalent decimals accepted
44.5 and 44.50 are both correct. Trailing zeros do not matter.
Fractions need not be reduced
If the answer is 3/44, entering 15/220 is also correct.
No units or symbols
Enter just the number. Do not include $, %, or commas. If the question asks 'what percent,' enter 20 for 20%.
Rounding must match instructions
If the question says 'to the nearest 0.01,' your answer must have exactly two decimal places.
Negative signs
If the answer is negative, include the minus sign. Use the on-screen hyphen or your keyboard.
Transfer buttons
On the GRE, you type in a scratch area and press Transfer to move the answer. On practice software, you type directly into the box.
Fraction entry: When the question gives you two boxes separated by a fraction bar, enter the numerator in the top box and the denominator in the bottom box. Do not enter a decimal in the fraction boxes — use them only for integer numerators and denominators.
Study Checklist
NE Data Analysis Mastery Checklist0/8 complete
Frequently Asked Questions
What types of Data Analysis topics appear in GRE Numeric Entry questions?
GRE Numeric Entry Data Analysis questions cover frequency distribution means, standard deviation relationships, probability and counting (combinations), weighted averages, interquartile range, and percent calculations from data displays such as tables and graphs. These questions often appear within Data Interpretation sets where a shared data display is followed by multiple questions.
How do I handle rounding instructions on Numeric Entry questions?
Always compute the exact answer first, then round as the very last step. Never round intermediate values, because rounding errors compound through subsequent calculations. If the question says "to the nearest 0.01," your answer must have exactly two decimal places. Entering a number with fewer or more decimal places than specified will typically be marked wrong.
What is the difference between entering a percent and a decimal on the GRE?
When a question asks "what percent," you enter the number without a percent sign. For example, if the answer is 20%, you enter 20, not 0.20. Entering the decimal form when a percent is requested is one of the most common errors on Numeric Entry questions. Read the question stem carefully to determine whether it asks for a percent value or a probability.
Do GRE Numeric Entry questions ever require computing standard deviation from raw data?
The GRE rarely requires a full standard deviation computation from scratch. Most standard deviation questions test conceptual understanding: knowing that a value k standard deviations above the mean equals μ+kσ, or solving a system of equations involving the mean and standard deviation. You should understand the formula conceptually but do not need to memorize it for rapid computation.
How should I approach counting problems on the GRE?
Use complementary counting when the condition involves "at least one" of something. Count the complement (the cases you do not want) and subtract from the total. For example, to count subsets with an even product, count the all-odd subsets and subtract from the total number of subsets. This technique is faster and less error-prone than enumerating every favorable case individually.