GRE Quantitative Comparison: Data Analysis Questions
Data Analysis Quantitative Comparison questions ask you to compare two quantities where the underlying math involves statistics, probability, counting, or interpretation of data displays. The format is always the same: compare Quantity A versus Quantity B and select from four fixed answer choices. Topics range from mean versus median in skewed distributions to standard deviation properties, normal distribution percentiles, frequency table medians, and probability comparisons. These questions test conceptual understanding more than brute-force calculation. Below you will learn the six question patterns that appear, work through two interactive examples step by step, and then practice with fourteen guided questions drawn from the question bank.
What Are QC Data Analysis Questions?
Quantitative Comparison questions on the GRE present two quantities and ask you to determine the relationship between them. When the domain is Data Analysis, the quantities involve statistics, probability, or data interpretation. You always choose from the same four answer options: Quantity A is greater, Quantity B is greater, the two are equal, or the relationship cannot be determined from the information given.
Additional information such as data sets, frequency tables, distribution descriptions, or graph references may appear above the two quantities. There is no partial credit, and you select exactly one answer. The questions tend to test conceptual understanding of statistics rather than brute-force calculation.
Key point: Unlike standard multiple-choice questions, QC questions always have exactly four answer choices. Answer D ("the relationship cannot be determined") is a valid answer when the data is insufficient to fix the comparison. Do not default to D when you are unsure — look for whether all possible cases yield the same result.
Six Question Patterns You Will See
Nearly every QC Data Analysis question falls into one of six patterns. Recognizing the pattern immediately tells you which statistical concept to apply.
1
Mean vs. Median Comparison
Compare the mean and median of a data set, combined lists, or distribution. The answer depends on skewness: right-skewed means the mean exceeds the median, left-skewed means the median exceeds the mean, and symmetric means they are equal.
2
Normal Distribution Percentile
Use properties of normal distributions (symmetry, density near the mean) to compare a percentile value to a given number. Equal percentile intervals near the center correspond to smaller raw-value spans than those in the tails.
3
Standard Deviation Comparison
Compare the standard deviations of two data sets using spread analysis. Adding a constant does not change standard deviation; multiplying by k scales it by ∣k∣. Data sets with identical shapes but different centers have the same standard deviation.
4
Frequency Distribution Median
Use cumulative frequencies to locate the median position in grouped data. Count through frequency bins from the lowest value upward to find which bin contains the median position.
5
Probability Comparison
Compare probabilities or expected values derived from given information. Often involves inclusion-exclusion, Venn diagrams, or conditional probability setups where missing information determines whether the answer is fixed or indeterminate.
6
Counting and Set Problems
Count elements satisfying divisibility or set membership conditions, then compare to a given value. May involve combinations, permutations, or simple enumeration. Watch for problems where a variable parameter changes the count.
Five Strategies for QC Data Analysis
These strategies apply across all six patterns. Master them and you will avoid the most common errors on QC Data Analysis questions.
In a right-skewed distribution (long tail to the right), the mean is greater than the median because extreme high values pull the average up. In a left-skewed distribution (long tail to the left), the mean is less than the median. In a symmetric distribution, the mean equals the median. This single concept resolves many QC Data Analysis questions.
Distribution Shape
Mean vs. Median
Right-skewed (tail to right)
Mean > Median
Left-skewed (tail to left)
Mean < Median
Symmetric
Mean = Median
Adding a constant to every value does NOT change the standard deviation. Multiplying every value by a constant k multiplies the standard deviation by ∣k∣. Standard deviation is always non-negative, and a data set where all values are equal has standard deviation 0. More spread-out data has a larger standard deviation. These properties let you compare standard deviations without computing them.
For a data set of n values: if n is odd, the median is the 2n+1 value when sorted; if n is even, the median is the average of the 2n and 2n+1 values. Count through the frequency distribution cumulatively to find which value occupies the median position. Be careful at boundaries where the cumulative frequency exactly reaches the median position.
For a normal distribution with mean μ and standard deviation σ: the distribution is symmetric about μ, about 68% of values fall within one standard deviation of the mean, about 95% fall within two standard deviations. The density is highest near the mean. Equal percentile intervals correspond to unequal raw-value intervals — percentile intervals closer to the mean span fewer raw units, and those in the tails span more raw units.
When the problem leaves some information unspecified (such as how many students scored each value, or how a variable is distributed), test at least two different valid cases. If both cases yield the same comparison, the answer is A, B, or C. If different cases yield different comparisons, the answer is D. This case-testing approach is essential for ruling out or confirming D.
Pro tip: On QC questions, you do not need to compute exact values. You only need to determine which quantity is larger (or whether it is indeterminate). Look for structural shortcuts — skewness, symmetry, transformation properties — before reaching for your calculator.
Worked Example: Mean vs. Median in a Skewed Distribution
Work through each step below. You must answer each mini-challenge correctly to unlock the next step. If you get stuck, a second wrong attempt will reveal the answer so you can keep going.
Interactive Walkthrough0/5 steps
Right-Skewed Histogram: Mean vs. Median
A histogram shows the frequency distribution of 80 data values grouped into 8 equal-width intervals, each spanning 10 units: [0, 10), [10, 20), [20, 30), [30, 40), [40, 50), [50, 60), [60, 70), and [70, 80). The frequencies for these intervals, from left to right, are: 22, 18, 14, 10, 7, 4, 3, 2.
Quantity A
Quantity B
The arithmetic mean of the 80 data values
The median of the 80 data values
Quantity A is greater
Quantity B is greater
The two quantities are equal
Cannot be determined
1
Step 1: Identify the distribution shape
The histogram shows frequencies decreasing from left to right (22, 18, 14, ..., 2). What type of skew does this distribution have?
2
Step 2: Recall the mean-median relationship for right-skewed data
3
Step 3: Find the median position
4
Step 4: Locate the median using cumulative frequencies
5
Step 5: Estimate the mean using interval midpoints
Worked Example: Normal Distribution Percentiles
This example teaches why linear interpolation between percentile values fails in a normal distribution. Work through each step to understand the underlying geometry of the normal curve.
Interactive Walkthrough0/5 steps
Normal Distribution: 60th Percentile vs. a Fixed Value
The random variable W is normally distributed. The value 320 is at the 40th percentile and the value 440 is at the 85th percentile of the distribution of W.
Quantity A
Quantity B
The value at the 60th percentile of the distribution of W
380
Quantity A is greater
Quantity B is greater
The two quantities are equal
Cannot be determined
1
Step 1: Understand what 380 represents
380 is the simple midpoint of 320 and 440. What is (320 + 440) / 2?
2
Step 2: Consider where the 60th percentile falls relative to the mean
3
Step 3: Find the mean approximately
4
Step 4: Compute the 60th percentile
5
Step 5: Make the comparison
Practice Questions
Now apply what you learned. Each question has a step-by-step solution walkthrough. After you submit your answer, click through the solution one step at a time to compare against your own work. All questions use the standard QC format with four fixed choices.
Question 1 — Standard Deviation and Linear Transformations
Data set S consists of n values with n > 2. Data set T is formed by multiplying each value in S by -3 and then adding 7 to each result.
Quantity A
Quantity B
The standard deviation of data set T
3 times the standard deviation of data set S
Select one answer:
Question 2 — Average with Incomplete Information
A class of 60 students took a test. Exactly 40 students scored 70, and each of the remaining 20 students scored either 50 or 90, but it is not known how many scored each value.
Quantity A
Quantity B
The average (arithmetic mean) of the 60 test scores
70
Select one answer:
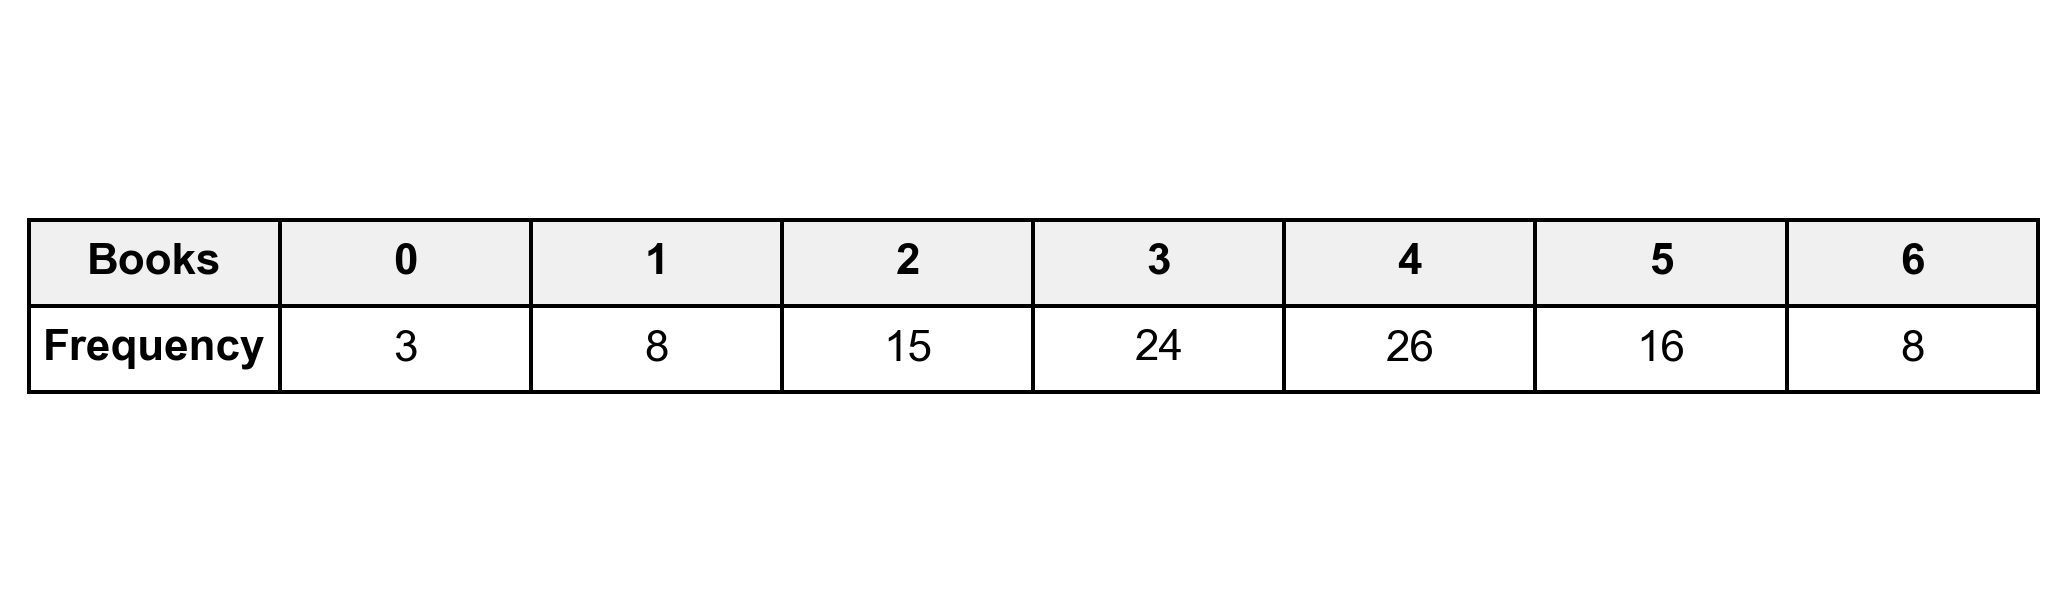
Question 3 — Median from a Frequency Table
A frequency table shows books read by 100 students during summer: 0 books (3 students), 1 book (8), 2 books (15), 3 books (24), 4 books (26), 5 books (16), 6 books (8).
Quantity A
Quantity B
The median number of books read by the 100 students
3
Select one answer:
Question 4 — Range Under a Linear Transformation
Data set R consists of 15 different integers. Data set V is formed by multiplying each value in R by -4 and then adding 20 to each result. The range of data set R is 30.
Quantity A
Quantity B
100
The range of data set V
Select one answer:
Question 5 — Probability with Incomplete Overlap
A group of 200 adults was surveyed: 140 own a car and 60 own a bicycle. The number who own both is x, where 0 < x <= 60.
Quantity A
Quantity B
The probability that a randomly selected adult owns neither a car nor a bicycle
101
Select one answer:
Question 6 — Interquartile Range Comparison
Data set P: {2, 5, 8, 12, 15, 18, 22, 26, 30, 35, 42}. Data set Q is formed from P by replacing the smallest value (2) with 10 and the largest value (42) with 34.
Quantity A
Quantity B
The interquartile range of data set Q
The interquartile range of data set P
Select one answer:
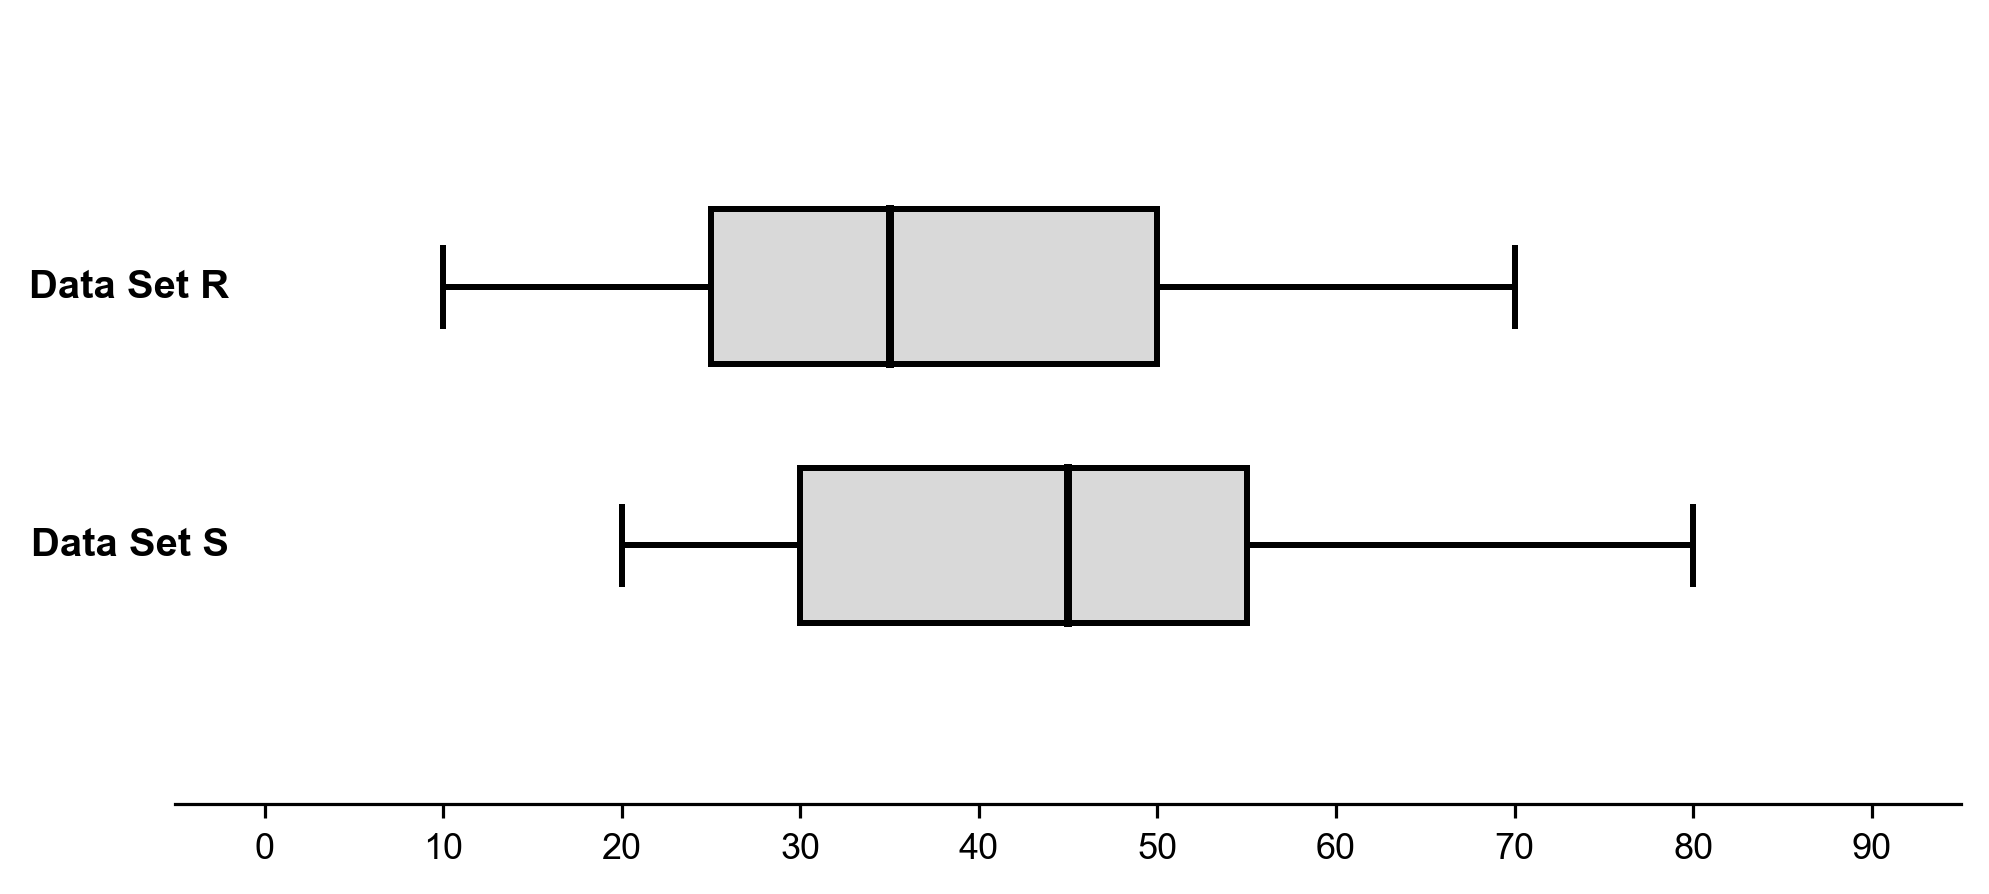
Question 7 — Median of Combined Data Sets
Data set R has 40 values (min=10, Q1=25, med=35, Q3=50, max=70). Data set S has 60 values (min=20, Q1=30, med=45, Q3=55, max=80). Combined data set T has 100 values; the 50th value when sorted is 38 and the 51st value is 40.
Quantity A
Quantity B
The median of data set T
38
Select one answer:
Question 8 — Counting Committees
A committee of 5 is selected from 6 men and 5 women. The committee must include at least 2 women. The integer k satisfies 3 ≤ k ≤ 5 and represents the number of women on the committee.
Quantity A
Quantity B
The number of possible committees with exactly k women
100
Select one answer:
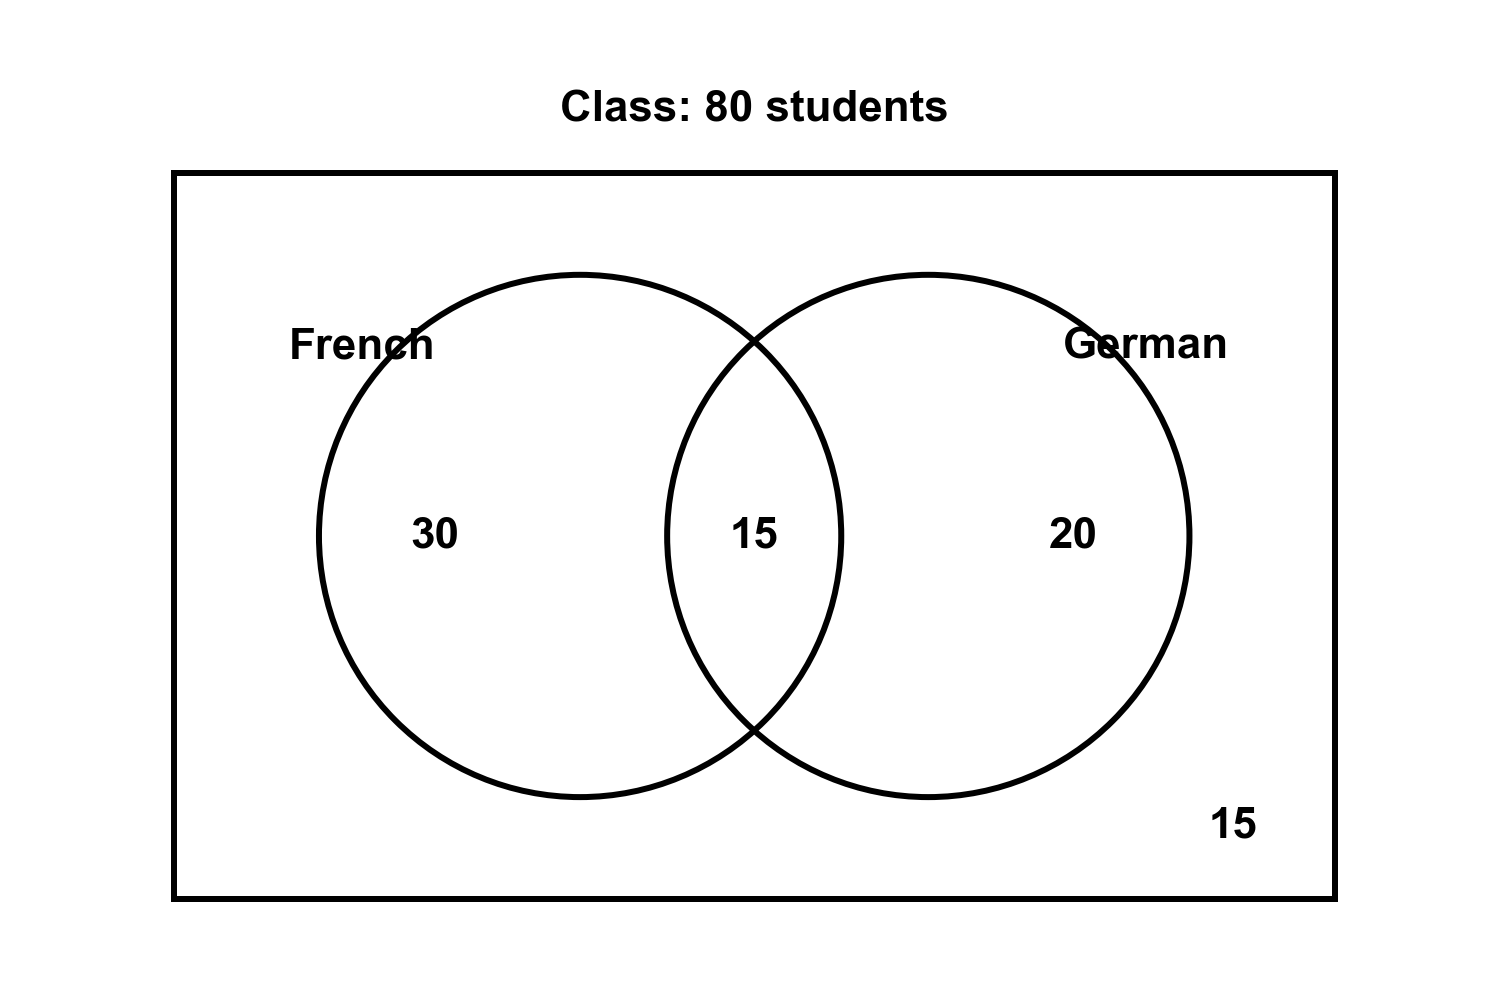
Question 9 — Inclusion-Exclusion Probability
In a class of 80 students, 45 study French, 35 study German, and 15 study both French and German. A student is selected at random.
Quantity A
Quantity B
The probability that the student studies exactly one of the two languages
85
Select one answer:
Question 10 — Modal Class Midpoint
A survey of 200 participants recorded ages in groups: 18-24 (frequency 32), 25-34 (frequency 58), 35-44 (frequency 48), 45-54 (frequency 35), 55-64 (frequency 27).
Quantity A
Quantity B
The midpoint of the modal class
29
Select one answer:
Question 11 — Variance with Unknown Parameters
Data set M consists of n identical values equal to 10, plus one additional value c (where c is not 10, and n ≥ 2). Data set N consists of {8, 10, 12}.
Quantity A
Quantity B
The variance of data set M
The variance of data set N
Select one answer:
Question 12 — Comparing Percentile Ranks Across Tests
Test X: normally distributed, mean 72, standard deviation 8. Test Y: normally distributed, mean 150, standard deviation 20. A student scored 88 on Test X and 185 on Test Y.
Quantity A
Quantity B
The student's percentile rank on Test Y
The student's percentile rank on Test X
Select one answer:
Question 13 — Normal Distribution: Comparing Standard Deviations
Variable X is normally distributed with the value 500 at the 30th percentile and the value 680 at the 70th percentile. Variable Y is normally distributed with the value 200 at the 20th percentile and the value 500 at the 80th percentile.
Quantity A
Quantity B
The standard deviation of X
The standard deviation of Y
Select one answer:
Question 14 — Left-Skewed Distribution: Mean vs. Median
A frequency distribution table shows 60 data values across 6 equal-width intervals. The intervals from left to right have frequencies: 2, 3, 5, 10, 18, 22.
Quantity A
Quantity B
The arithmetic mean of the 60 data values
The median of the 60 data values
Select one answer:
Four Common Traps
Trap 1 — Assuming mean equals median. This is only true for perfectly symmetric distributions. On the GRE, if a histogram or frequency distribution is given, check the shape for skewness before assuming equality. A right-skewed distribution always has mean greater than median.
Trap 2 — Confusing "2 standard deviations above the mean" with "the mean plus 2." Two standard deviations above the mean is μ+2σ, not μ+2. The standard deviation is a scaling factor specific to the data, not a fixed unit. Always identify the numerical value of σ before computing.
Trap 3 — Linear interpolation between percentiles in a normal distribution. The 75th percentile is NOT the midpoint between the 60th and 90th percentile values. Because the normal curve is denser near the mean, equal percentile intervals in the tails cover wider raw-value ranges than those near the center.
Trap 4 — Thinking that adding a constant changes the standard deviation. If every value increases by 6, the mean increases by 6, but the standard deviation stays exactly the same. Shifting all data by the same amount changes only the center, not the spread. Only multiplication by a constant changes the standard deviation.
How the Four Answer Choices Work
Every Quantitative Comparison question on the GRE uses the same four answer choices. Understanding when each applies is crucial for Data Analysis QC questions.
Answer
When to Select
Example
A: Quantity A is greater
The statistical reasoning definitively shows A exceeds B in all valid cases
Right-skewed distribution: mean (A) is always greater than median (B)
B: Quantity B is greater
The reasoning definitively shows B exceeds A in all valid cases
Normal distribution: a percentile value (A) falls below the naive midpoint (B)
C: The two are equal
Both quantities have the same value after computation or reasoning
SD(T)=3×SD(S) when T is formed by multiplying S by −3 and adding 7
D: Cannot be determined
The data is partially specified, and different valid configurations produce different comparisons
Unknown split of scores: some splits give A > B, others give B > A
When you suspect the answer is D, always test at least two cases. If one case gives A greater and another gives B greater (or equal), D is confirmed. If every case you try gives the same result, the answer is probably A, B, or C — but make sure you have tested a sufficiently diverse set of cases.
Strategy reminder: Do not default to D when you are unsure. Answer D is correct only when the problem genuinely leaves information unspecified. If all the data is given (like a complete frequency table or a known distribution shape), the answer will be A, B, or C.
Study Checklist
QC Data Analysis Mastery Checklist0/8 complete
Frequently Asked Questions
What topics appear in GRE Quantitative Comparison Data Analysis questions?
QC Data Analysis questions cover mean versus median comparisons, standard deviation properties, normal distribution percentiles, frequency distribution medians, probability comparisons, and counting or set problems. The format always uses the four fixed QC answer choices. Topics include arithmetic mean, median, mode, range, standard deviation, percentiles, normal distributions, probability, combinations, and permutations.
How do I compare the mean and median without computing both?
Use skewness. In a right-skewed distribution the mean exceeds the median because high values in the tail pull the average upward. In a left-skewed distribution the mean is less than the median. In a symmetric distribution they are equal. If you can determine the skew from a histogram or frequency table, you immediately know the relationship between mean and median without calculating either one.
Does adding a constant to every value in a data set change the standard deviation?
No. Adding or subtracting the same constant to every value shifts the entire data set without changing the spread. The standard deviation remains unchanged. Multiplying every value by a constant k multiplies the standard deviation by ∣k∣. This distinction is tested frequently in QC Data Analysis questions.
How do I find the median from a frequency distribution table?
Build cumulative frequencies by adding frequencies from the lowest value upward. For n data values, the median position is the (n+1)/2 value if n is odd, or the average of the n/2 and (n/2+1) values if n is even. Count through the cumulative frequencies to identify which value occupies that position. Pay special attention when the cumulative frequency exactly reaches the median position, as the next value may come from a different group.
Are percentile intervals evenly spaced in a normal distribution?
No. In a normal distribution the density is highest near the mean. Equal percentile intervals near the center of the distribution correspond to smaller raw-value spans, while equal percentile intervals in the tails correspond to larger raw-value spans. This means you cannot linearly interpolate between percentile values. The midpoint of two percentile values does not correspond to the midpoint of the two percentile ranks.