Now readingIntroduction
0%
AP Physics 1: Algebra-Based · Framework 2026-27
Unit 1

Kinematics

Kinematics describes how position and velocity change before asking which interactions caused the change.

Topics
5

Introduction

Kinematics describes how position and velocity change before asking which interactions caused the change.

Begin every motion analysis by naming the object, observer, origin, positive directions, and clock. Those choices give signs physical meaning. A negative coordinate or velocity is not automatically smaller or slower; it points opposite the chosen positive axis.

Motion diagrams, graphs, tables, and equations are different views of the same motion. Translate by using slope for a rate and signed area for an accumulated change. The constant-acceleration equations are powerful only after the acceleration model has been justified.

01
Position and displacement

locate change along declared axes

02
Velocity and acceleration

describe successive rates of change

03
Graphs and equations

connect slopes, signed areas, and constant-acceleration models

04
Components and frames

separate observer effects and perpendicular directions

Current exam guidance: Aligned to the current 2026–27 AP Physics 1 framework, with algebra-based modeling, experimental reasoning, and explicit assumptions.
1.1

Scalars and Vectors in One Dimension

How can one trip have negative displacement but positive distance?

Short answer

Displacement is a signed change in position, while distance adds nonnegative path lengths; a sign represents direction only after the positive axis is declared.

Know firstSigned numbers · Measurement magnitude · Coordinate axes

Direction enters through the coordinate system

Model the traveler as a point on a straight axis and declare east as +x+x. Position tells where the point is relative to the origin. Displacement compares two positions: Δx=xf−xi\Delta x=x_f-x_i. Therefore Δx=−3 m\Delta x=-3\ \mathrm{m} means a 3 m change toward the west; its magnitude is 3 m3\ \mathrm{m}. Distance instead totals the length of every segment traveled, so it cannot be negative.

Vector addition preserves direction. A trip of +5 m+5\ \mathrm{m} followed by −8 m-8\ \mathrm{m} has net displacement −3 m-3\ \mathrm{m} but distance 13 m13\ \mathrm{m}. If the axis is reversed, every position and component changes sign, yet the physical trip, vector magnitudes, and distance stay the same. That invariance is a useful check. A drawn arrow is quantitative only when its length is tied to a stated scale.

Physics model

A coordinate choice gives every vector its sign

Move an object directly from an initial position at the origin, then compare signed position, displacement, and path length.

Signed position
5 m
Displacement from xi=0x_i=0
5 m
Distance traveled
5 m
originpositive directionposition vector
A coordinate choice gives every vector its signMove an object directly from an initial position at the origin, then compare signed position, displacement, and path length. The table below states the model assumptions and relationships without relying on color or motion.-8-7-6-5-4-3-2-1012345678origin
Δx=xf−xi\Delta x=x_f-x_i
Read this figure without the graphic

Move an object directly from an initial position at the origin, then compare signed position, displacement, and path length. The table below states the model assumptions and relationships without relying on color or motion.

QuantityMeaning
Initial positionxi=0x_i=0 m
Distance traveled∣xf∣|x_f| for this direct path
Displacementxf−xix_f-x_i with sign

Audit one out-and-back trip

  1. ΔxAB=xB−xA=+5 m\Delta x_{AB}=x_B-x_A=+5\ \mathrm{m}.
  2. ΔxBC=xC−xB=−8 m\Delta x_{BC}=x_C-x_B=-8\ \mathrm{m}.
  3. Net displacement is +5+(−8)=−3 m+5+(-8)=-3\ \mathrm{m}; distance is ∣5∣+∣−8∣=13 m|5|+|-8|=13\ \mathrm{m}.
  4. Reversing the axis changes the component signs but leaves 13 m of path and a 3 m displacement magnitude.
Result
Δx=−3 m,d=13 m\Delta x=-3\ \mathrm{m},\qquad d=13\ \mathrm{m}
Units: Displacement and distance are both measured in metres; only displacement carries axis direction.

Boundary cases

  • If the traveler never reverses, distance equals the magnitude of displacement.
  • For motion off one line, components must be treated separately before recombination.

The signed segment changes add to negative three metres, while their absolute lengths add to thirteen metres.

Keep vector and path ledgers separate

  1. Declare the origin and positive direction.
  2. Compute each displacement from final position minus initial position.
  3. Add signed displacements for the net change.
  4. Add segment magnitudes for total distance.
  5. Report a direction or sign with the displacement.

Keep these three ideas

  • A scalar has magnitude; a vector has magnitude and direction.
  • Displacement is final position minus initial position.
  • Distance adds path lengths and is never negative.
1.2

Displacement, Velocity, and Acceleration

What changes define velocity and acceleration, and what do their signs mean?

Short answer

Velocity is position change per time and acceleration is velocity change per time; their signs give axis direction, not a direct verdict about whether an object is speeding up.

Know firstSigned displacement · Ratios · SI units

Rates compare two states over one clock interval

Treat the moving object as a point in an inertial laboratory frame. For Δt=tf−ti>0\Delta t=t_f-t_i>0, average velocity is vavg,x=Δx/Δtv_{\mathrm{avg},x}=\Delta x/\Delta t and average acceleration is aavg,x=Δvx/Δta_{\mathrm{avg},x}=\Delta v_x/\Delta t. Their SI units are m/s\mathrm{m/s} and m/s2\mathrm{m/s^2}. An instantaneous value describes the rate at one moment and can be estimated from a short interval, provided measurement noise does not dominate.

A sign identifies direction along the selected axis. Speed increases when velocity and acceleration point in the same direction and decreases when they point oppositely. Thus an object moving left with leftward acceleration has vx<0v_x<0 and ax<0a_x<0 but speeds up. At the top of an ideal vertical toss, vy=0v_y=0 for an instant while ay=−ga_y=-g remains. Average speed, total distance divided by elapsed time, generally differs from the magnitude of average velocity.

Physics model

Velocity and acceleration describe different changes

Scrub through constant-acceleration motion and compare position, velocity, and acceleration at the same instant.

Position
9 m
Velocity
6 m/s
Acceleration
2 m/s²
positionvelocityacceleration
Velocity and acceleration describe different changesScrub through constant-acceleration motion and compare position, velocity, and acceleration at the same instant. The table below states the model assumptions and relationships without relying on color or motion.same instant
v=v0+atv=v_0+at
Read this figure without the graphic

Scrub through constant-acceleration motion and compare position, velocity, and acceleration at the same instant. The table below states the model assumptions and relationships without relying on color or motion.

QuantityMeaning
Positionx=1+2t+t2x=1+2t+t^2 m
Velocityv=2+2tv=2+2t m/s
Accelerationa=2a=2 m/s²
Formula

Average motion rates

vavg,x=ΔxΔt,aavg,x=ΔvxΔt\displaystyle v_{\mathrm{avg},x}=\frac{\Delta x}{\Delta t},\qquad a_{\mathrm{avg},x}=\frac{\Delta v_x}{\Delta t}

Average velocity measures signed position change per time; average acceleration measures signed velocity change per time.

Use when
Use one frame, one axis convention, and a positive elapsed time for both endpoint states.
Do not assume
These interval averages need not equal the instantaneous value at either endpoint.

Use signs to determine the speed trend

Velocity signAcceleration signWhat happens to speed
positivepositiveincreases
positivenegativedecreases
negativepositivedecreases
negativenegativeincreases

Interpret a rate without losing its sign

  1. Name the frame and positive axis.
  2. Subtract final minus initial for the numerator.
  3. Divide by the positive elapsed time and attach units.
  4. Use the signs of velocity and acceleration together to decide the speed trend.
  5. Distinguish an interval average from an instantaneous rate.

Keep these three ideas

  • Velocity tracks displacement per time.
  • Acceleration tracks velocity change per time.
  • Matching signs increase speed; opposite signs decrease it.
1.3

Representing Motion

How do diagrams, graphs, equations, and words describe the same motion?

Short answer

They agree when graph slopes encode rates, signed areas encode accumulated changes, and constant-acceleration equations are restricted to intervals where acceleration is constant.

Know firstAverage velocity and acceleration · Graph slope · Signed geometric area

Translate with slopes and signed areas

Choose an origin, a positive axis, and t=0t=0 before comparing representations. In a motion diagram, dots mark equal time intervals, so widening spacing indicates increasing speed. On an xx-versus-tt graph, slope is velocity; the graph’s height is position, not speed. On a vv-versus-tt graph, slope is acceleration and signed area is displacement. Area below the time axis means displacement in the negative direction, not negative distance.

When acceleration is constant, velocity changes by equal amounts in equal times. The average velocity over the interval is (v0+v)/2(v_0+v)/2, so combining Δx=vavgt\Delta x=v_{\mathrm{avg}}t with v=v0+atv=v_0+at gives Δx=v0t+12at2\Delta x=v_0t+\tfrac12at^2. The related equation v2=v02+2aΔxv^2=v_0^2+2a\Delta x removes time. A curved velocity graph signals nonconstant acceleration, so one constant-aa equation cannot span that entire interval even though graph slope and area remain useful conceptually.

Physics model

Slope and area connect the three motion graphs

Follow one time marker across position, velocity, and acceleration graphs so corresponding features stay aligned.

Current time
2.5 s
Velocity
3.5 m/s
Acceleration
1 m/s²
position graphvelocity graphacceleration graph
Slope and area connect the three motion graphsFollow one time marker across position, velocity, and acceleration graphs so corresponding features stay aligned. The table below states the model assumptions and relationships without relying on color or motion.xva
slope of x(t)=v(t),area under a(t)=Δv\text{slope of }x(t)=v(t),\qquad \text{area under }a(t)=\Delta v
Read this figure without the graphic

Follow one time marker across position, velocity, and acceleration graphs so corresponding features stay aligned. The table below states the model assumptions and relationships without relying on color or motion.

QuantityMeaning
xx–tt slopeInstantaneous velocity
vv–tt slopeAcceleration
aa–tt areaChange in velocity
Physics in practice
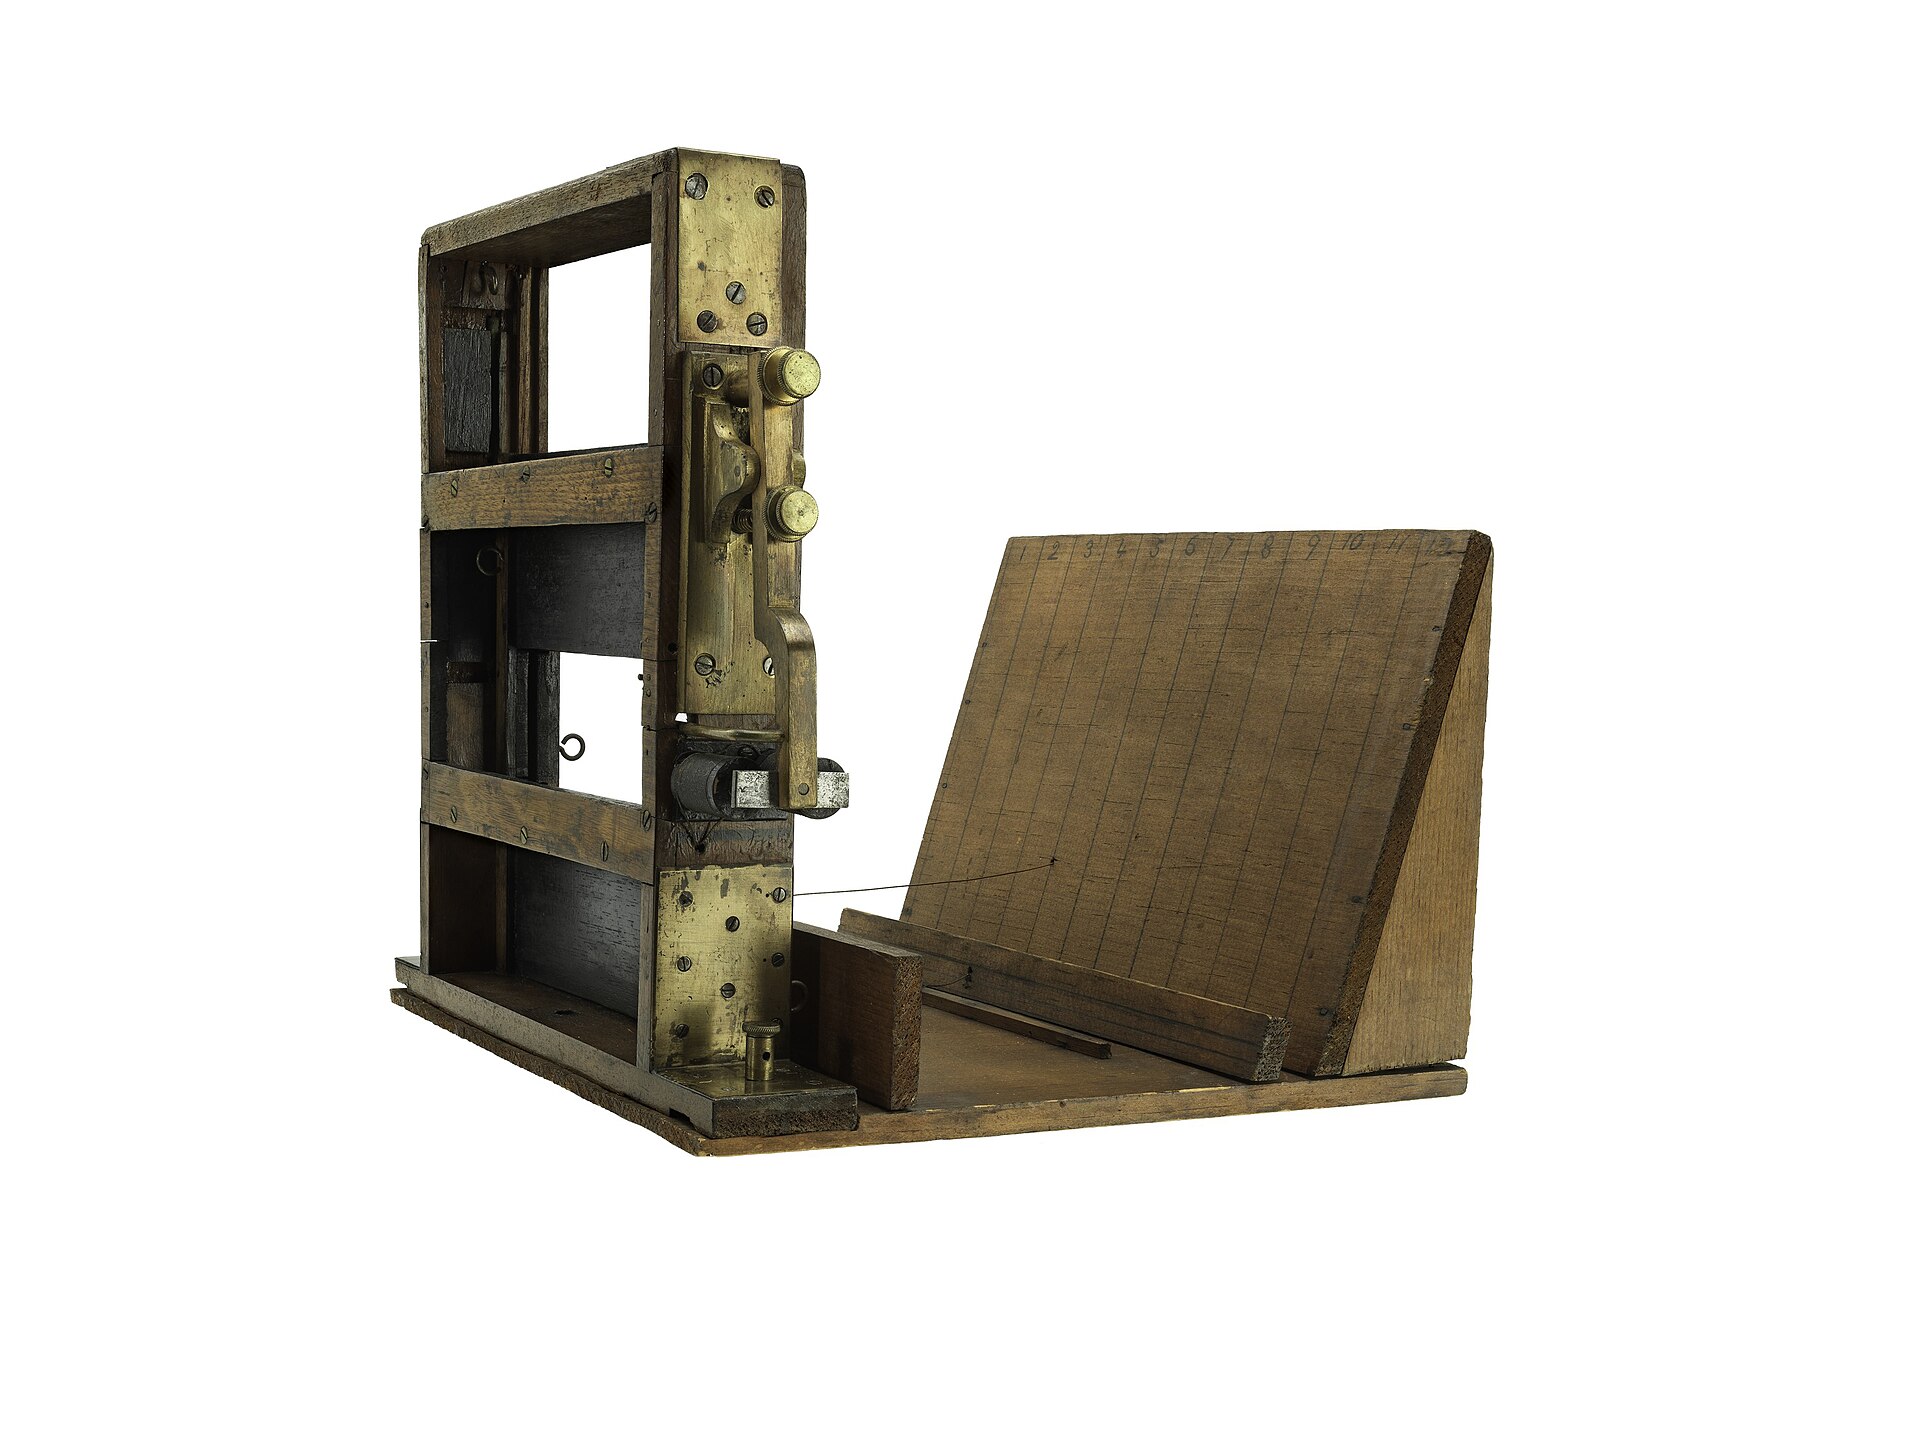
Wood-and-brass nineteenth-century apparatus used to photograph objects at measured positions during motion.

Motion records begin with a clock and a scale

Muybridge’s apparatus paired timed exposures with a ruled background. Modern video analysis follows the same logic: calibrate position, preserve the time interval, and compare successive frames.

Use this visual to see
Connect a motion diagram to the measurement system that produces its position and time data.
What it cannot show
The apparatus does not itself provide a velocity graph, and irregular exposure timing or perspective would distort a motion record.

Build the displacement equation without calculus

  1. Constant acceleration gives v=v0+atv=v_0+at.
  2. A linear velocity-time graph has average height vavg=(v0+v)/2v_{\mathrm{avg}}=(v_0+v)/2.
  3. Displacement is average velocity times time: Δx=vavgt\Delta x=v_{\mathrm{avg}}t.
  4. Substitute v=v0+atv=v_0+at and simplify.
Result
Δx=v0t+12at2\Delta x=v_0t+\frac12at^2
Units: Every term has units of metres.

Boundary cases

  • a=0a=0 reduces the result to Δx=v0t\Delta x=v_0t.
  • Nonconstant acceleration breaks the average-of-endpoint-velocities step.

For constant acceleration, the velocity-time graph is a line and its trapezoid area equals displacement.

Read each graph by its axes

GraphSlope meansSigned area means
position versus timevelocityno standard kinematics quantity
velocity versus timeaccelerationdisplacement
acceleration versus timerate of acceleration change, not required quantitativelyvelocity change

Move between representations

  1. Read the plotted variables and units.
  2. Translate slopes before interpreting the curve visually.
  3. Translate signed areas using the vertical-axis units times seconds.
  4. Check whether acceleration is constant before selecting a kinematics equation.
  5. Confirm that the diagram spacing, graph trend, and signs tell one consistent story.

Keep these three ideas

  • Slope gives the rate named by the graph axes.
  • Signed area under velocity gives displacement.
  • Constant-acceleration equations do not cover an interval with changing acceleration.
1.4

Reference Frames and Relative Motion

Which motion quantities change between observers moving at constant relative velocity?

Short answer

Inertial observers can assign different positions and velocities to one object, but they agree on its acceleration when their frames move at constant relative velocity.

Know firstSigned vector components · Velocity definitions · Subscript notation

An observer supplies coordinates and a clock

Define vA/Bv_{A/B} as the velocity of A measured by B and keep one positive direction. In one dimension, vA/C=vA/B+vB/Cv_{A/C}=v_{A/B}+v_{B/C} and vA/B=−vB/Av_{A/B}=-v_{B/A}. If a train moves at +12 m/s+12\ \mathrm{m/s} relative to the ground while a passenger walks at −2 m/s-2\ \mathrm{m/s} relative to the train, the ground observer measures the passenger at +10 m/s+10\ \mathrm{m/s}. Both reports can be correct because they answer different observer questions.

For frames moving at constant relative velocity VV whose origins coincide at t=0t=0, the coordinate relation is x′=x−Vtx\prime=x-Vt, so v′=v−Vv\prime=v-V and a′=aa\prime=a. A different initial origin adds a constant position offset but does not change the velocity or acceleration relations. The acceleration agrees because the subtracted frame velocity does not change. If the observing vehicle accelerates, that final equality fails and the simple inertial-frame treatment no longer applies. Changing observers is also distinct from reversing the axis: one subtracts frame motion, while the other changes the signs assigned to every component.

Physics model

Changing frames changes measured velocity

Change the observer’s velocity and compare ground-frame, observer-frame, and relative velocities.

Object velocity
6 m/s
Observer velocity
2 m/s
Relative velocity
4 m/s
object velocityobserver velocityrelative velocity
Changing frames changes measured velocityChange the observer’s velocity and compare ground-frame, observer-frame, and relative velocities. The table below states the model assumptions and relationships without relying on color or motion.
vA/B=vA/G−vB/Gv_{A/B}=v_{A/G}-v_{B/G}
Read this figure without the graphic

Change the observer’s velocity and compare ground-frame, observer-frame, and relative velocities. The table below states the model assumptions and relationships without relying on color or motion.

QuantityMeaning
Object in ground frame+6+6 m/s
Observer in ground frameSelected value
Object relative to observer6−vobserver6-v_{observer} m/s
Physics in practice
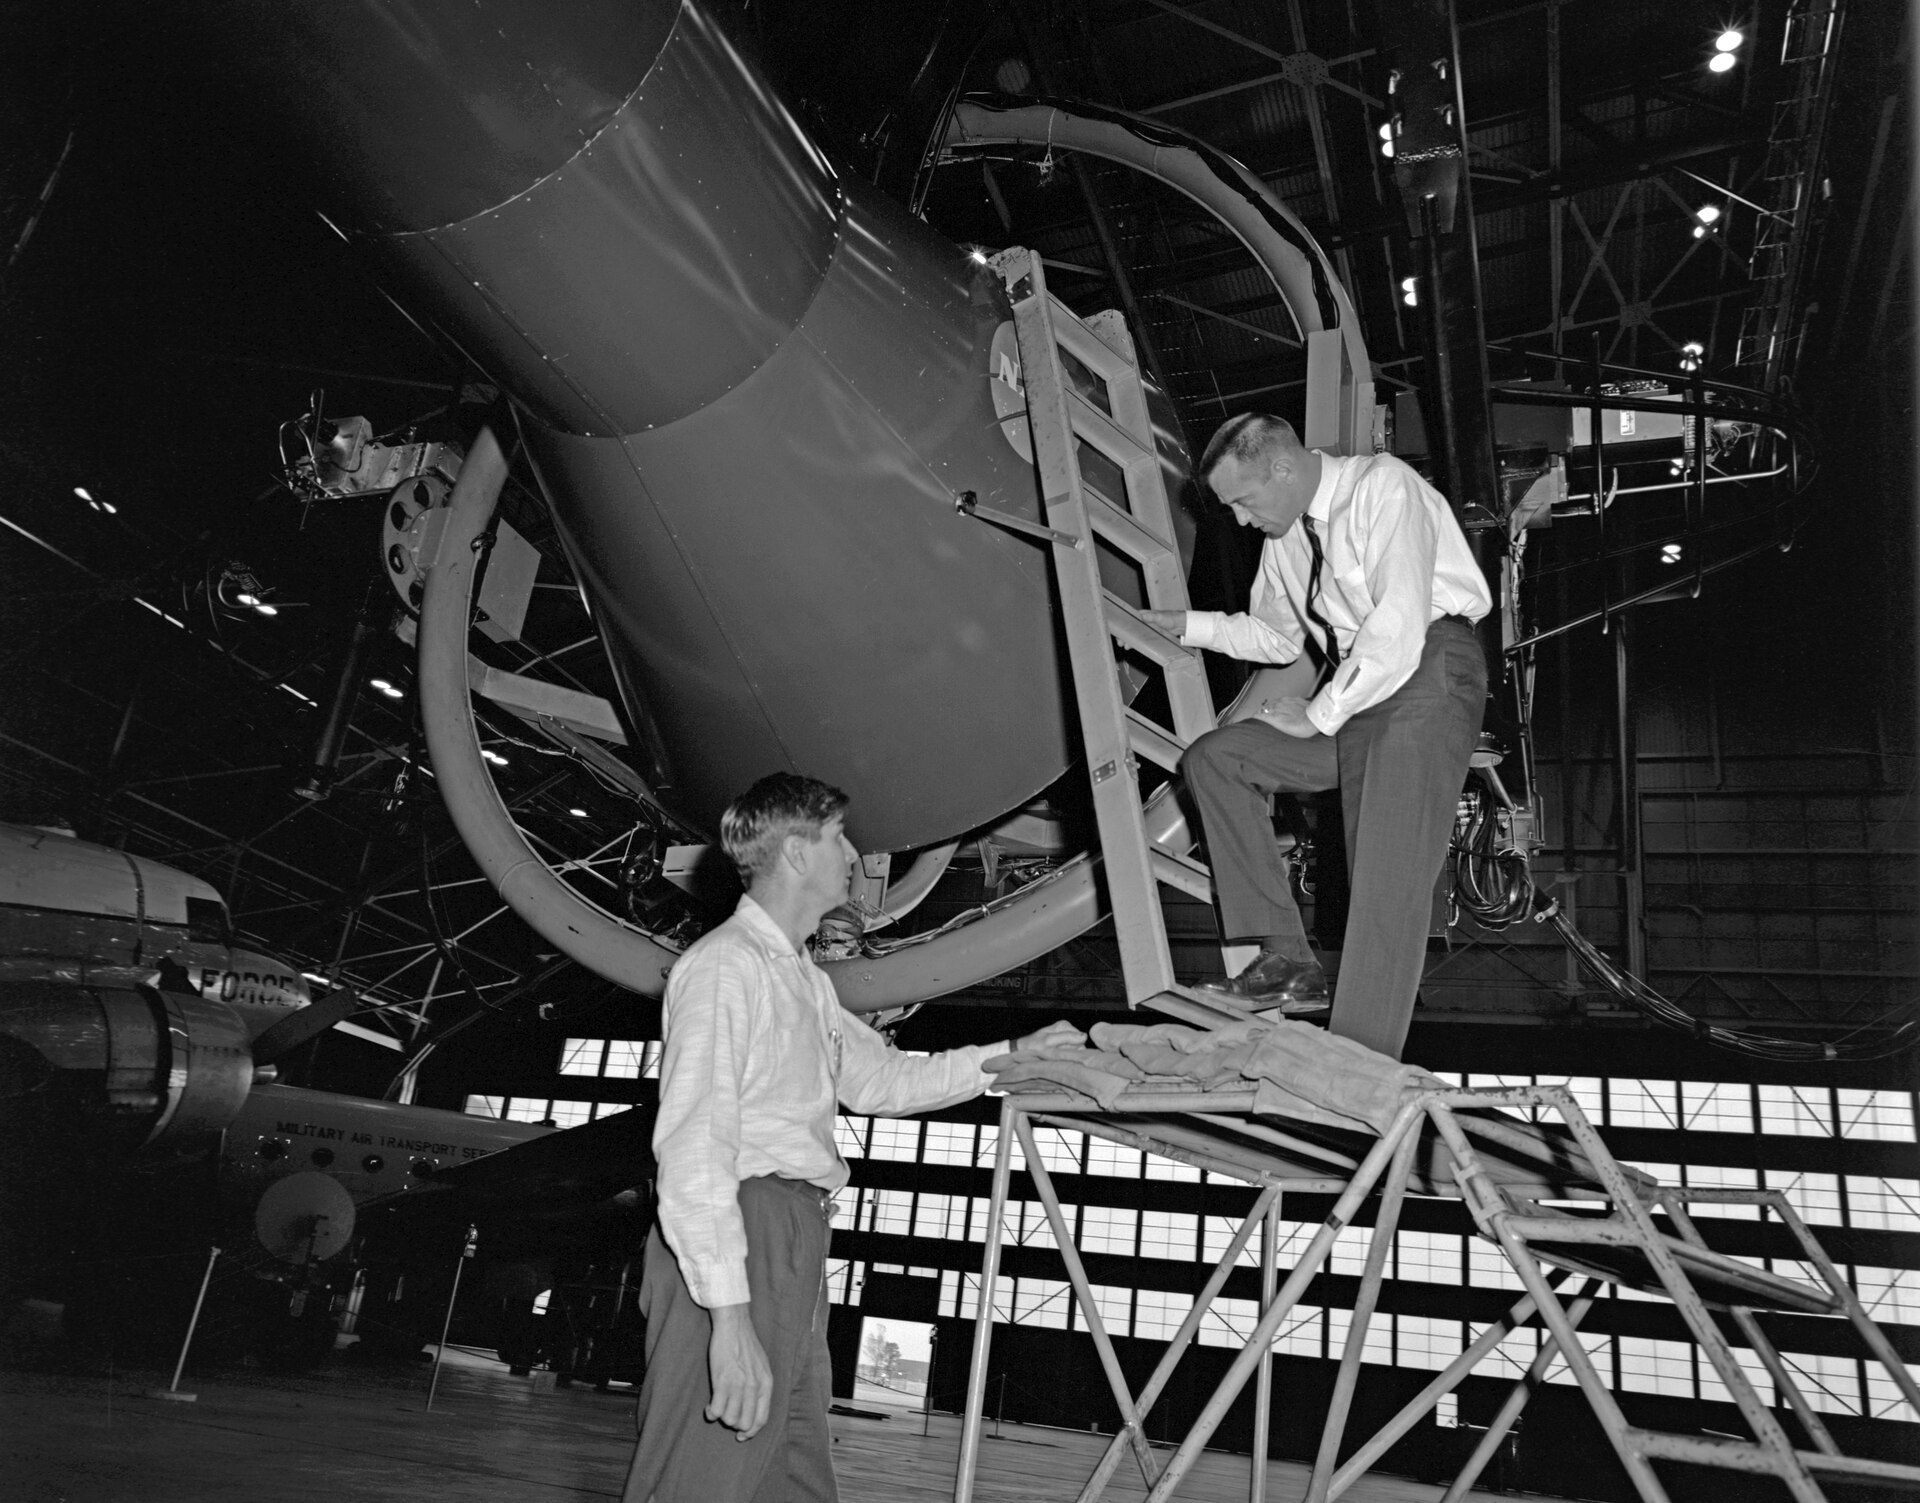
Alan Shepard entering a large NASA rendezvous and docking simulator in a hangar.

A simulator fixes the observer’s frame

A docking simulator gives the pilot a defined viewpoint, coordinate system, and controlled relative motion. The target’s measured velocity depends on that selected frame.

Use this visual to see
Identify the observer before assigning a sign or value to relative velocity.
What it cannot show
The photograph shows the simulator hardware, not the mathematical transformation between two inertial frames.

Use the subscripts as an accounting chain

  1. Write the target quantity vP/Gv_{P/G}.
  2. Choose the chain P/TP/T followed by T/GT/G so the intermediate frame matches.
  3. Add signed components: vP/G=vP/T+vT/Gv_{P/G}=v_{P/T}+v_{T/G}.
  4. Interpret the positive result as forward motion relative to the ground.
Result
vP/G=+10 m/sv_{P/G}=+10\ \mathrm{m/s}
Units: All three velocity components use metres per second.

Boundary cases

  • If vP/T=−12 m/sv_{P/T}=-12\ \mathrm{m/s}, the passenger is instantaneously at rest relative to the ground.
  • If the train accelerates, train and ground observers need not agree on acceleration.

Walking backward at two metres per second inside a train moving forward at twelve leaves a forward ground velocity of ten metres per second.

Build a relative-velocity chain

  1. Write what each subscript means in words.
  2. Declare one positive direction for every component.
  3. Arrange intermediate frames so the chain connects the requested objects.
  4. Add signed components and attach the observer to the answer.
  5. Check the reversed relation vA/B=−vB/Av_{A/B}=-v_{B/A}.

Keep these three ideas

  • Velocity is relative to an observer.
  • Relative velocities add as signed one-dimensional components.
  • Constant-relative-velocity frames agree on acceleration.
1.5

Vectors and Motion in Two Dimensions

Why can ideal projectile motion be solved as two one-dimensional motions sharing one time?

Short answer

Perpendicular components respond independently to their own acceleration components, then recombine at each shared time to locate one moving object.

Know firstRight-triangle trigonometry · Vector components · Constant-acceleration equations

Resolve first, evolve second, recombine last

Choose perpendicular axes and measure θ\theta from +x+x. Then Ax=Acos⁡θA_x=A\cos\theta and Ay=Asin⁡θA_y=A\sin\theta, while A=Ax2+Ay2A=\sqrt{A_x^2+A_y^2}. The signs and quadrant are needed when recovering direction; an inverse tangent alone can select the wrong quadrant. Rotating the axes changes the component numbers but not the vector’s physical magnitude or direction.

For an ideal projectile near Earth, neglect air resistance and treat gravity as uniform: ax=0a_x=0 and ay=−ga_y=-g. Thus x=x0+v0xtx=x_0+v_{0x}t while y=y0+v0yt−12gt2y=y_0+v_{0y}t-\tfrac12gt^2. The horizontal velocity remains constant as the vertical velocity changes. At the apex vy=0v_y=0, but vxv_x usually remains nonzero, so the projectile is not at rest. Both component equations use the same elapsed time because they describe one object. Drag would couple acceleration to the full velocity and break this ideal independence.

Physics model

Projectile motion is two linked one-dimensional motions

Advance time while horizontal velocity remains constant and vertical velocity changes under gravity.

Horizontal position
9.6 m
Vertical velocity
0.24 m/s
Vertical acceleration
−9.8 m/s²
horizontal componentvertical componentparabolic path
Projectile motion is two linked one-dimensional motionsAdvance time while horizontal velocity remains constant and vertical velocity changes under gravity. The table below states the model assumptions and relationships without relying on color or motion.
x=v0xt,y=y0+v0yt−12gt2x=v_{0x}t,\qquad y=y_0+v_{0y}t-\tfrac12gt^2
Read this figure without the graphic

Advance time while horizontal velocity remains constant and vertical velocity changes under gravity. The table below states the model assumptions and relationships without relying on color or motion.

QuantityMeaning
Horizontal acceleration00
Vertical acceleration−g-g
VelocityVector sum of current components
Physics in practice
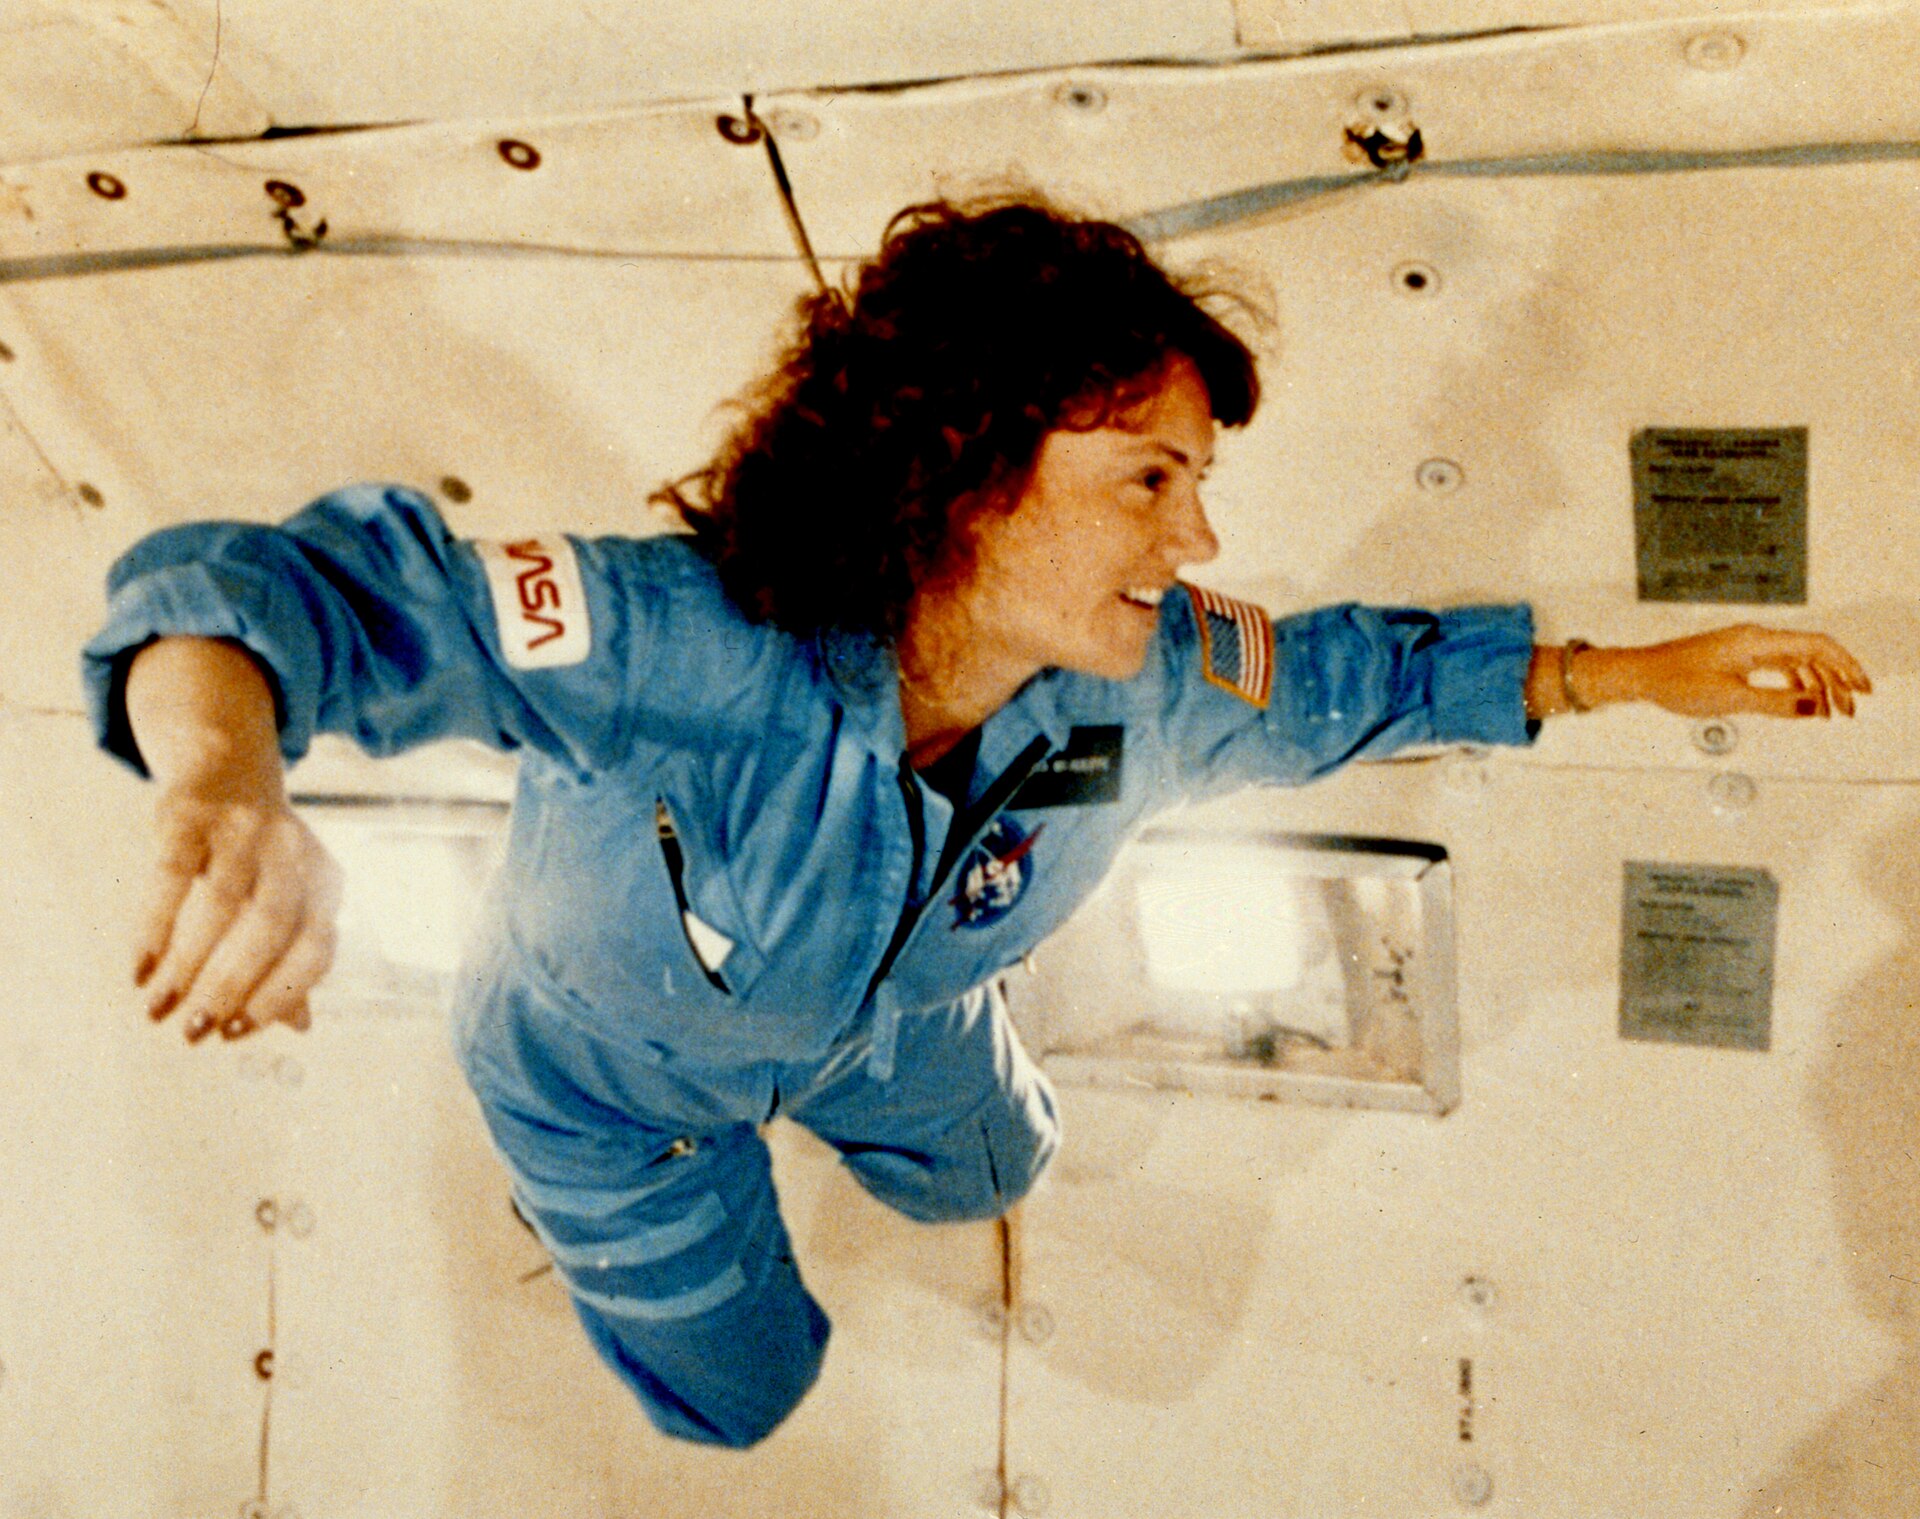
Christa McAuliffe floating inside a NASA KC-135 aircraft during a parabolic flight.

Weightlessness can occur during ordinary free fall

During the free-fall portion of a parabolic flight, the aircraft and its occupants accelerate together. The apparent weight can approach zero even though Earth’s gravitational force remains present.

Use this visual to see
Separate gravitational acceleration from the contact force a scale would read.
What it cannot show
A still image cannot show the aircraft’s trajectory, acceleration interval, or air-resistance corrections.

Track an ideal launch by components

  1. Resolve the launch: v0x=8 m/sv_{0x}=8\ \mathrm{m/s} and v0y=6 m/sv_{0y}=6\ \mathrm{m/s}.
  2. At the apex, vy=v0y−gt=0v_y=v_{0y}-gt=0, so tup=0.6 st_{up}=0.6\ \mathrm{s}.
  3. Symmetry at equal heights gives total flight time 1.2 s1.2\ \mathrm{s}.
  4. Horizontal range is v0xt=8(1.2)=9.6 mv_{0x}t=8(1.2)=9.6\ \mathrm{m}.
Result
tflight=1.2 s,R=9.6 mt_{\mathrm{flight}}=1.2\ \mathrm{s},\qquad R=9.6\ \mathrm{m}
Units: Velocity is in m/s, time in s, acceleration in m/s², and range in m.

Boundary cases

  • At the apex, only the vertical velocity component is zero.
  • Unequal launch and landing heights remove the simple time symmetry.

The launch separates into constant horizontal motion and uniformly accelerated vertical motion that share a 1.2-second flight time.

Solve a two-dimensional motion model

  1. Draw axes and resolve the initial vector into signed components.
  2. Write a separate motion equation for each axis.
  3. Identify the one shared time or another condition linking the components.
  4. Solve within each axis, then recombine components if magnitude or direction is requested.
  5. Check the ideal assumptions against drag, Earth curvature, and field variation.

Keep these three ideas

  • Resolve vectors with signed components and quadrant information.
  • Ideal projectile components evolve independently under ax=0a_x=0 and ay=−ga_y=-g.
  • The two component motions share one elapsed time.

Kinematics review

A correct motion model keeps the object, observer, axes, clock, and assumptions consistent while translating among diagrams, graphs, tables, and equations.

Recognize immediately

  • State an axis before interpreting the sign of a vector component.
  • Read slope and signed area from the axes rather than from the graph’s visual shape alone.
  • Use constant-acceleration equations only over an interval with constant acceleration.
  • Give horizontal and vertical projectile components the same elapsed time.

Practice AP Physics 1 in the real test engine.

Free practice set: timed, the same engine as our full-length tests, every answer explained.