Now readingIntroduction
0%
AP Psychology · Framework 2026-27
Unit 1

Biological Bases of Behavior

Behavior emerges from interacting biological systems: inherited variation develops within environments, neurons carry signals, networks coordinate responses, and sensory receptors translate physical energy.

Exam weight
15–25%
Topics
6

Introduction

Behavior emerges from interacting biological systems: inherited variation develops within environments, neurons carry signals, networks coordinate responses, and sensory receptors translate physical energy.

This unit follows information from the body’s environment into the nervous system and back out as action. Keep levels of analysis separate. A neuron fires, a circuit coordinates activity, and a person behaves; evidence at one level does not automatically prove a claim at another.

Biological explanations are strongest when they state a mechanism and a limit. Brain imaging can locate an association without proving necessity, heritability describes variation in a population rather than a person, and a simplified diagram can orient anatomy without assigning a complex behavior to one structure.

01
Heredity × environment

developing behavioral variation

02
Neural and endocrine signaling

coordination across the body

03
Brain networks and sleep rhythms

organized states and behavior

04
Sensory transduction

physical energy becomes neural information

Biological systems distinctions

Match each expression with the condition that makes it valid.

Current exam guidance: Aligned to the current 2026–27 AP Psychology framework and its emphasis on concepts, research methods, data interpretation, and evidence-based argument.
1.1

Interaction of Heredity and Environment

How do heredity and environment jointly shape behavior?

Short answer

Inherited predispositions develop in environments that can amplify, redirect, or suppress their expression, so neither source acts as an independent behavioral cause.
Know firstExperimental and correlational evidence · Population versus individual claims

Development is an interaction, not a split

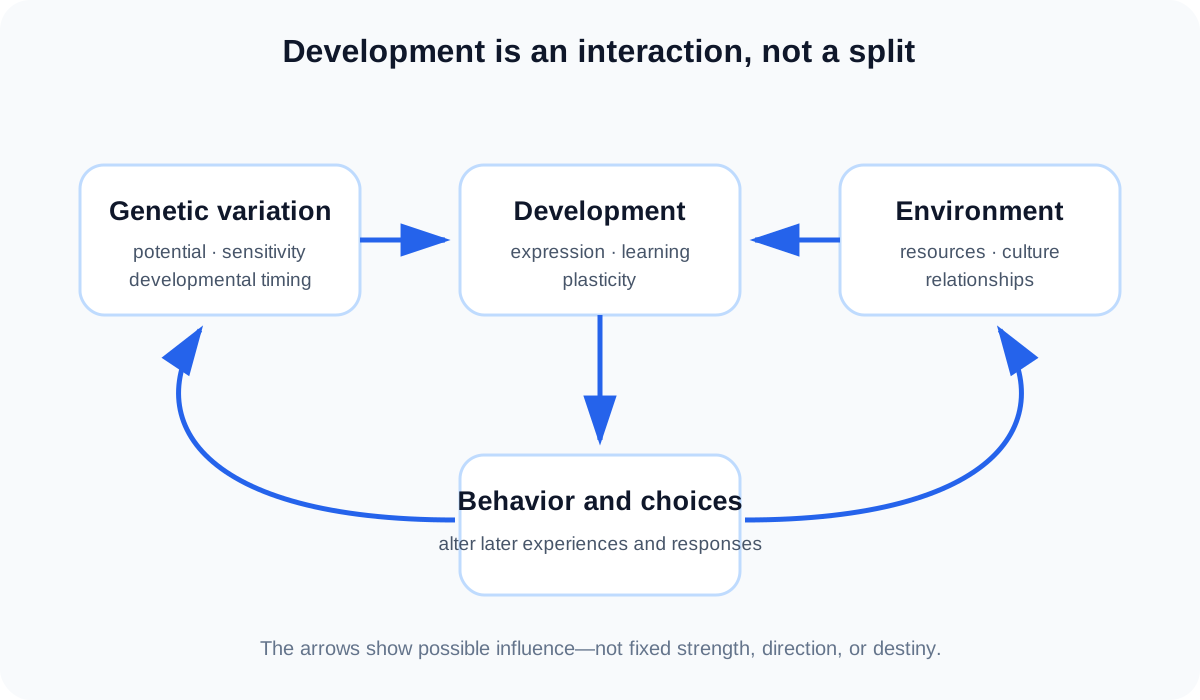
Heredity supplies biological variation; environment includes nutrition, learning, stress, relationships, culture, and other conditions in which development occurs. Their effects are transactional. A predisposition can change which environments a person seeks, and an environment can change how strongly a predisposition appears. The useful question is not whether a behavior is nature or nurture, but how the two sources combine over time.

Twin, adoption, and family studies compare similarity under different patterns of genetic relatedness and shared experience. Greater similarity among identical than fraternal twins can support a genetic contribution, but it does not isolate genes perfectly because environments may also differ systematically. Random assignment to heredity is impossible, so these designs support qualified inferences rather than simple causal percentages.

Heritability estimates the proportion of observed variation in a defined population, under its current range of environments, associated with genetic variation. It does not divide one person into genetic and environmental percentages. A highly heritable characteristic can still change if the environment changes. Evolutionary explanations also require evidence that a trait affected reproductive success, not merely a plausible survival story.

Teaching figure
Feedback diagram linking genetic variation, environments, development, behavior, and environmental response

Genes and environments form a feedback system

Behavior develops through repeated interaction. Genetic differences can affect which environments people encounter, while environments influence when and how inherited potentials are expressed.

Use this visual to see
Trace reciprocal influence instead of dividing an outcome into separate genetic and environmental percentages.
What it cannot show
Arrows connect genetic variation and environmental conditions through development and behavior, then loop behavior back to later environments. The diagram shows pathways, not the size or inevitability of any effect.

Test Ninjas · Original educational diagram

Read an interaction before naming a cause

Do two environments affect both predisposition groups in the same way?

Read an interaction before naming a cause dataset
Predisposition groupEnvironment A meanEnvironment B meanChange
Group 14055+15
Group 24575+30
Original synthetic fixture
Provided accessible table
Read an interaction before naming a cause accessible table
GroupABChange
1405515
2457530

Interpret behavioral-genetic evidence

  1. Name the population and environments represented.
  2. Identify which similarities and differences were actually measured.
  3. Separate genetic relatedness from shared-environment assumptions.
  4. Treat heritability as a population statistic, not an individual diagnosis.
  5. Reject group ranking or eugenic conclusions that the design cannot support.

Keep these three ideas

  • Heredity and environment transact across development.
  • Behavioral-genetic designs depend on assumptions about relatedness and environments.
  • Heritability describes population variance, not individual composition or immutability.
1.2

Overview of the Nervous System

How does the nervous system coordinate information and action?

Short answer

The central nervous system integrates signals, while peripheral sensory and motor pathways connect it with receptors, muscles, glands, and organs.
Know firstStructure–function reasoning

Follow direction before memorizing divisions

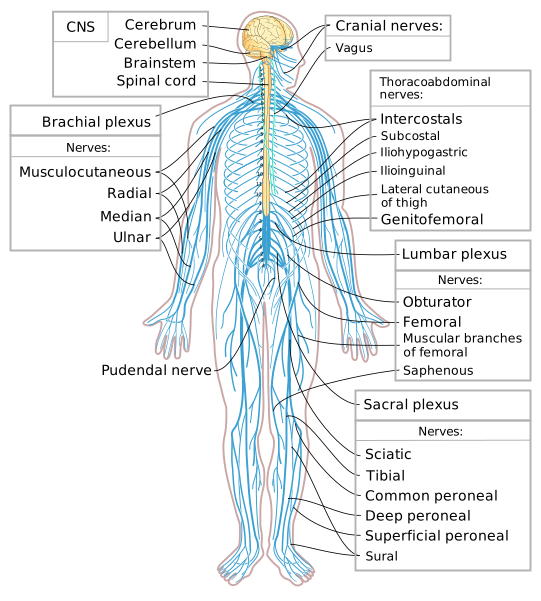
The brain and spinal cord form the central nervous system (CNS). Everything outside them belongs to the peripheral nervous system (PNS). Sensory, or afferent, pathways carry information from receptors toward the CNS. Motor, or efferent, pathways carry commands from the CNS toward muscles and glands. A reflex may be integrated in the spinal cord before the brain produces conscious awareness, so “somatic” does not always mean deliberately chosen.

The motor PNS includes the somatic system, which controls skeletal muscle, and the autonomic system, which regulates organs and glands. Sympathetic activity mobilizes resources during challenge; parasympathetic activity supports maintenance and recovery. They coordinate rather than behaving as exact on/off opposites. Both can be active in a complex response.

The endocrine system also coordinates the body, but glands release hormones into the bloodstream. Hormonal signals are generally slower to arrive and longer lasting than rapid neural signals. Neural and endocrine systems interact: brain regions can direct hormone release, and circulating hormones can alter brain and body activity.

Teaching figure
Diagram of the human central and peripheral nervous systems

The nervous system as a nested map

Use the image to locate the brain and spinal cord inside the larger peripheral network. It shows gross anatomy, not the direction of a specific signal.

Use this visual to see
Orient the CNS–PNS distinction before tracing functional pathways.
What it cannot show
The brain and spinal cord form a central vertical system; branching nerves extend into the head, trunk, arms, and legs.

Medium69 and Jmarchn · CC BY-SA 4.0 · Wikimedia Commons

Map each pathway by direction and target

Division or pathwayDirection or targetExample functionLimit
sensory / afferentreceptors → CNSskin input reaches spinal corddoes not itself name conscious perception
motor / efferentCNS → effectorscommand reaches muscle or glandincludes somatic and autonomic output
sympatheticorgans and glandsmobilizes resourcesnot inherently harmful
parasympatheticorgans and glandssupports maintenancenot active only during sleep
endocrinehormones through bloodlonger-lasting coordinationtiming varies by hormone and target

Keep these three ideas

  • Afferent travels toward the CNS; efferent travels away.
  • Somatic and autonomic systems are motor divisions.
  • Hormonal signaling is generally slower and longer lasting than neural transmission.
1.3

The Neuron and Neural Firing

How does a neuron transmit information?

Short answer

A neuron integrates inputs, fires an all-or-none action potential when threshold is reached, and releases neurotransmitters that change the next cell’s probability of firing.
Know firstNervous-system pathways · Electrical charge

A signal changes form across the neuron

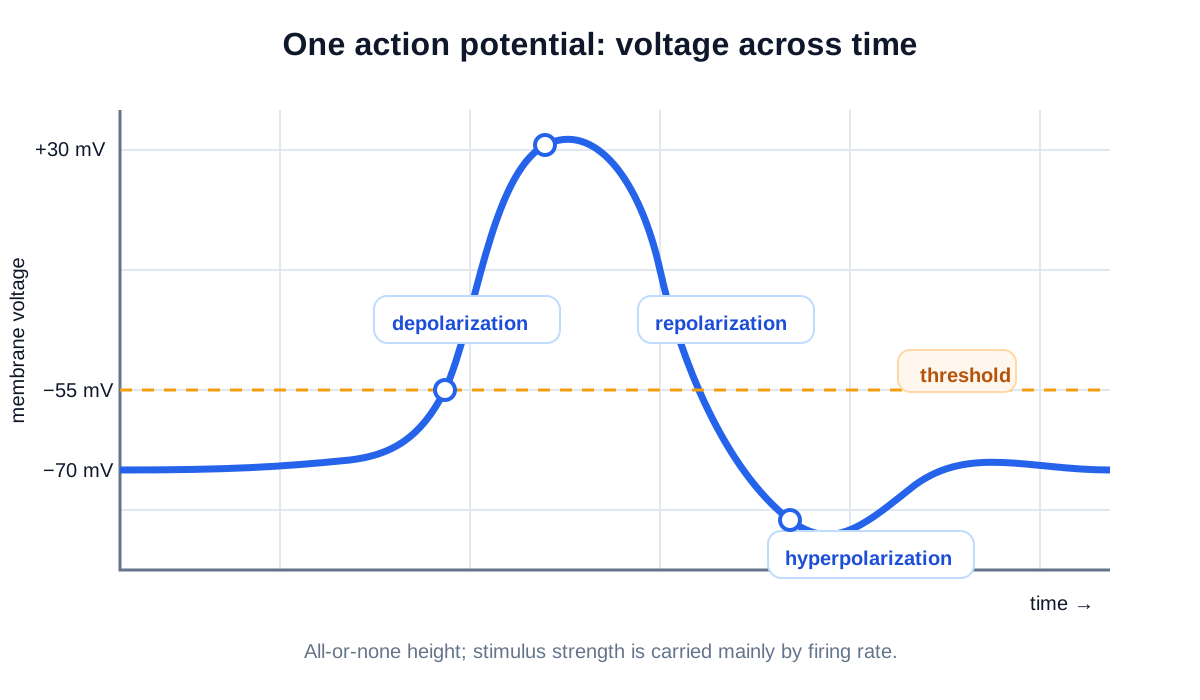
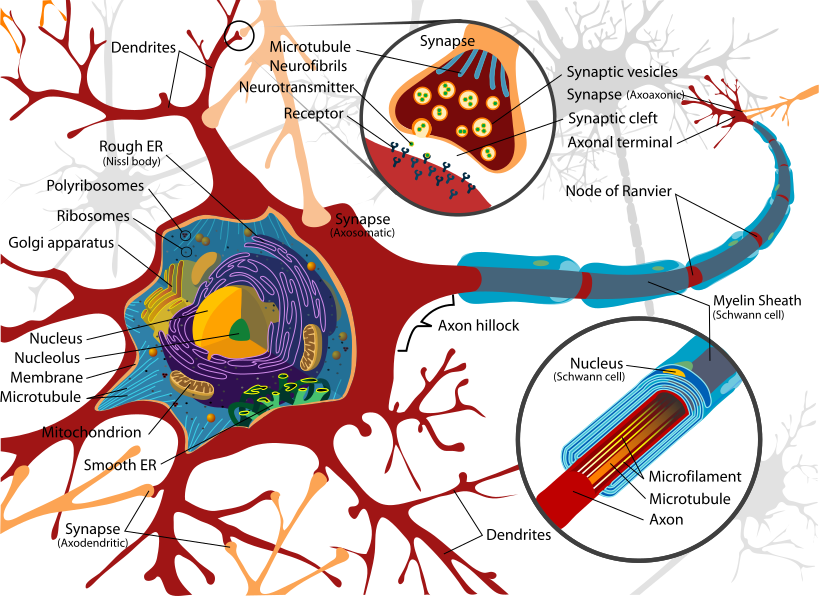
Dendrites receive signals, the cell body integrates them, and the axon carries an action potential toward terminals. Myelin insulates sections of many axons and speeds propagation; glial cells support, protect, and regulate neural environments. At rest, the membrane maintains an electrical difference. Excitatory and inhibitory inputs change that difference. If their summed effect reaches threshold, a sequence of ion-channel changes produces depolarization, repolarization, and a brief refractory period.

The action potential follows the all-or-none principle: once threshold is crossed, a stronger input does not create a taller spike. Intensity can instead change firing frequency or recruit more neurons. At the terminal, electrical activity triggers neurotransmitter release into the synapse. Receptors on the next cell convert that chemical signal into a postsynaptic effect, and reuptake, enzymatic breakdown, or diffusion clears the transmitter.

A neurotransmitter is not simply excitatory or inhibitory everywhere. Its effect depends on receptor type and circuit. Likewise, an agonist increases a transmitter system’s effect and an antagonist reduces it, but neither term identifies whether behavior will increase or decrease. Simple “chemical imbalance” claims omit receptor, network, development, and context.

Teaching figure
Graph of membrane voltage showing threshold, depolarization, repolarization, hyperpolarization, and refractory recovery

An action potential is a timed change in voltage

Once threshold is reached, voltage rises and falls in a stereotyped sequence. Stronger stimulation changes firing frequency, not the height of one action potential.
Use this visual to see
Follow the phases of neural firing and locate the refractory interval.
What it cannot show
A voltage trace begins at resting potential, crosses threshold, peaks, falls below rest, and gradually recovers. The graph is schematic and does not represent every neuron’s exact voltage or duration.

Test Ninjas · Original educational diagram

Teaching figure
Labeled neuron showing dendrites, cell body, axon, myelin, and terminals

Structure supports signal direction

Signals typically enter through dendrites and soma and propagate along the axon toward terminals. The drawing is a structural overview, not a scale model.

Use this visual to see
Connect parts of a neuron to the sequence of neural communication.
What it cannot show
Branching dendrites enter a cell body on the left; a long myelinated axon extends rightward to branching terminals.

LadyofHats · Public domain · Wikimedia Commons

Keep the firing sequence in order

StageWhat changesWhat not to infer
resting potentialmembrane maintains charge separationthe neuron is not inactive
thresholdsummed input reaches trigger levela larger trigger will not make a larger spike
action potentialdepolarization then repolarization propagatesinformation is not carried by spike height
synaptic releasetransmitter binds receptorsone transmitter does not have one universal effect
clearancereuptake, breakdown, or diffusion reduces signalclearance is not identical in every synapse

Keep these three ideas

  • Inputs sum at the neuron before threshold.
  • Action potentials are all-or-none.
  • Synaptic effects depend on receptors and circuits.
1.4

The Brain

How do brain structures and research methods support explanations of behavior?

Short answer

Brain structures make specialized contributions within distributed networks, and causal confidence depends on whether a method measures, disrupts, or directly changes activity.
Know firstNeural signaling · Correlation versus causation

Specialization works through networks

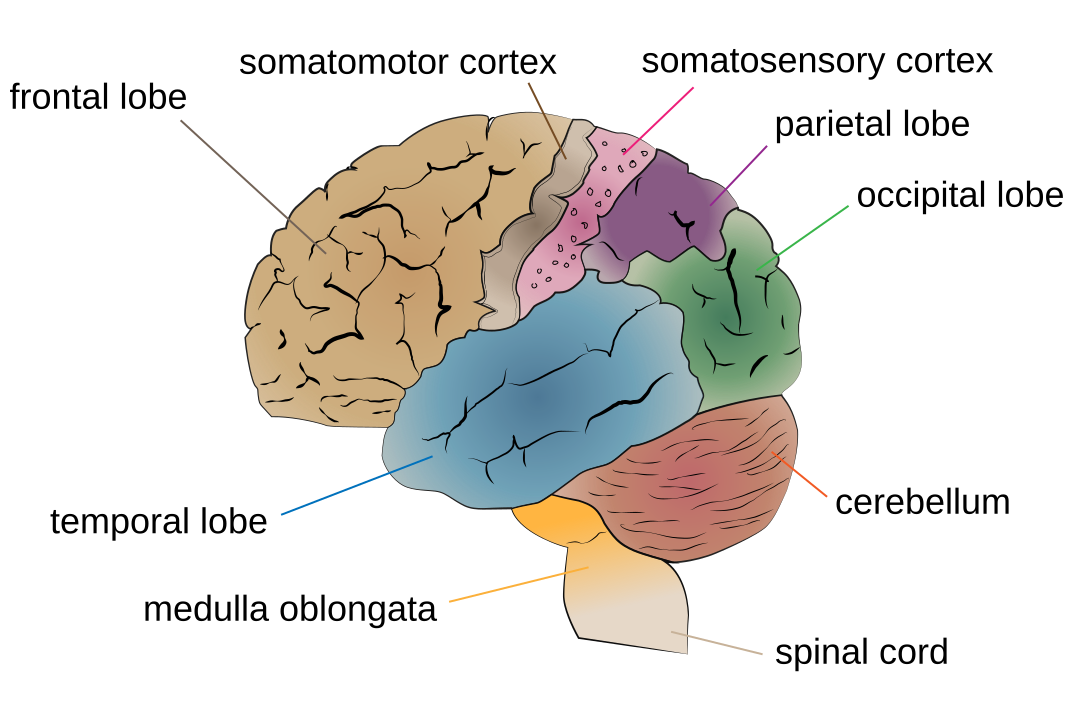
The brainstem supports basic life functions; the medulla helps regulate breathing and circulation, the pons participates in sleep and movement, and the reticular activating system contributes to arousal and alertness. The cerebellum coordinates movement and supports forms of learning. The thalamus relays much sensory information, while the hypothalamus links motivated behavior, autonomic regulation, and endocrine control.

The hippocampus supports formation of new explicit memories; the amygdala contributes to detecting and learning emotional significance; the basal ganglia support action selection and habit. The cortex includes frontal, parietal, temporal, and occipital lobes, plus motor, somatosensory, and association regions. These are contribution maps, not isolated “centers.” Reading, deciding, or remembering recruits interacting regions.

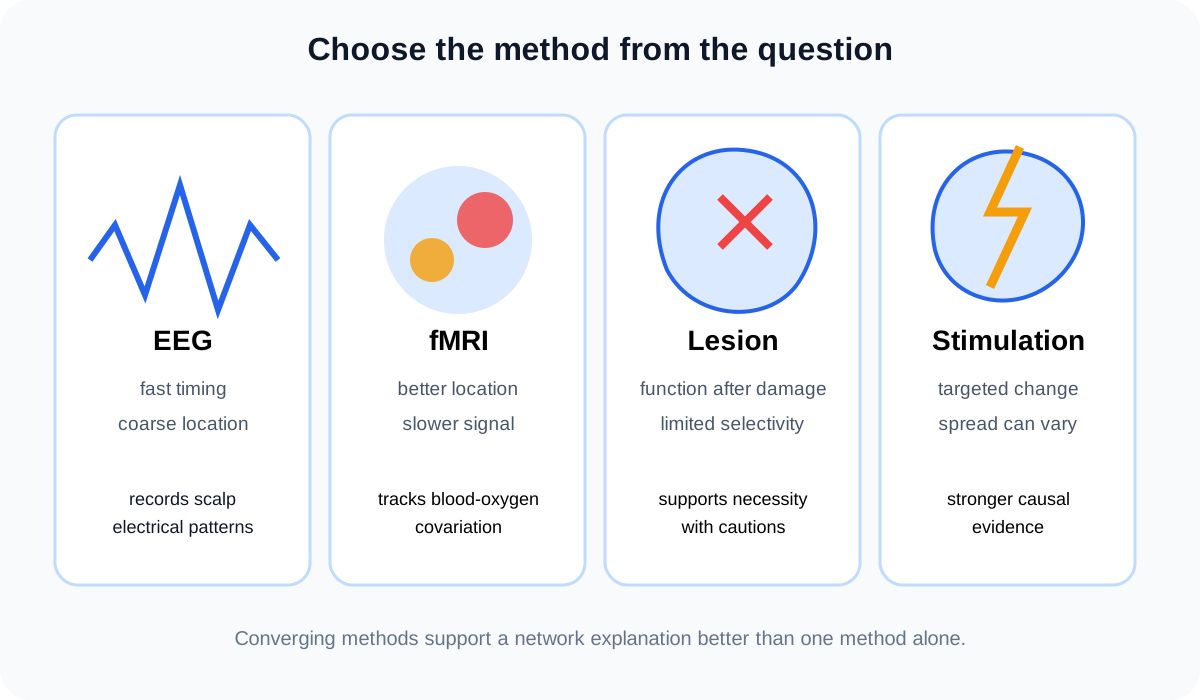
Methods answer different questions. EEG records rapid electrical patterns at the scalp but localizes sources imprecisely. fMRI tracks blood-oxygen-related changes with better spatial than temporal resolution; activation is correlational. Lesions can show that damage is associated with impaired function, though injuries are rarely selective. Stimulation can provide stronger causal evidence for a targeted contribution. Plasticity permits reorganization, but recovery is constrained rather than unlimited.

Teaching figure
Four-panel comparison of EEG, fMRI, lesion evidence, and stimulation by timing, location, and causal strength

Brain methods answer different questions

Each method trades one strength for another. A bright image, a fast signal, and a causal perturbation are different forms of evidence.
Use this visual to see
Match a research question to the observation and inference a brain method can support.
What it cannot show
EEG is shown as fast electrical timing, fMRI as spatial blood-oxygen mapping, lesion evidence as function after damage, and stimulation as targeted perturbation. No method is presented as a complete picture of thought.

Test Ninjas · Original educational diagram

Teaching figure
Detailed lateral brain diagram labeling the frontal, parietal, temporal, and occipital lobes plus the motor and somatosensory regions

Lobes are landmarks, not behavior boxes

Use the colored regions to orient the major lobes and the two cortical strips. Their borders organize anatomy; they do not divide thought into isolated compartments.

Use this visual to see
Locate major cortical landmarks while resisting one-region–one-behavior reasoning.
What it cannot show
A lateral view separates the frontal, parietal, temporal, and occipital lobes and marks the motor and somatosensory regions near their shared boundary. The cerebellum and brainstem appear below and behind the cerebrum.

Jkwchui; adapted from U.S. National Cancer Institute material · CC BY-SA 3.0 · Wikimedia Commons: Cerebrum lobes

Match method to inference

MethodPrimary observationBest-supported inferenceMain limit
EEGscalp electrical pattern over timetiming of population activityweak spatial localization
fMRIblood-oxygen-related changeactivity covaries with task or conditiondoes not prove necessity
lesion evidencefunction after tissue damagedamaged region or network may be necessarydamage and compensation are not selective
stimulationbehavior after targeted perturbationchanged activity contributed causally under tested conditionstarget spread and artificial conditions

Keep these three ideas

  • Brain regions contribute within networks.
  • Method determines the strength and kind of inference.
  • Lateralization and plasticity are constrained, not personality labels or unlimited recovery.
1.5

Sleep

How do biological rhythms and sleep stages relate to behavior?

Short answer

Circadian timing and rising homeostatic pressure organize recurring NREM and REM states that support functioning, although cycle timing and sleep need vary.
Know firstBrain measurement · Biological rhythms

Two pressures organize sleep

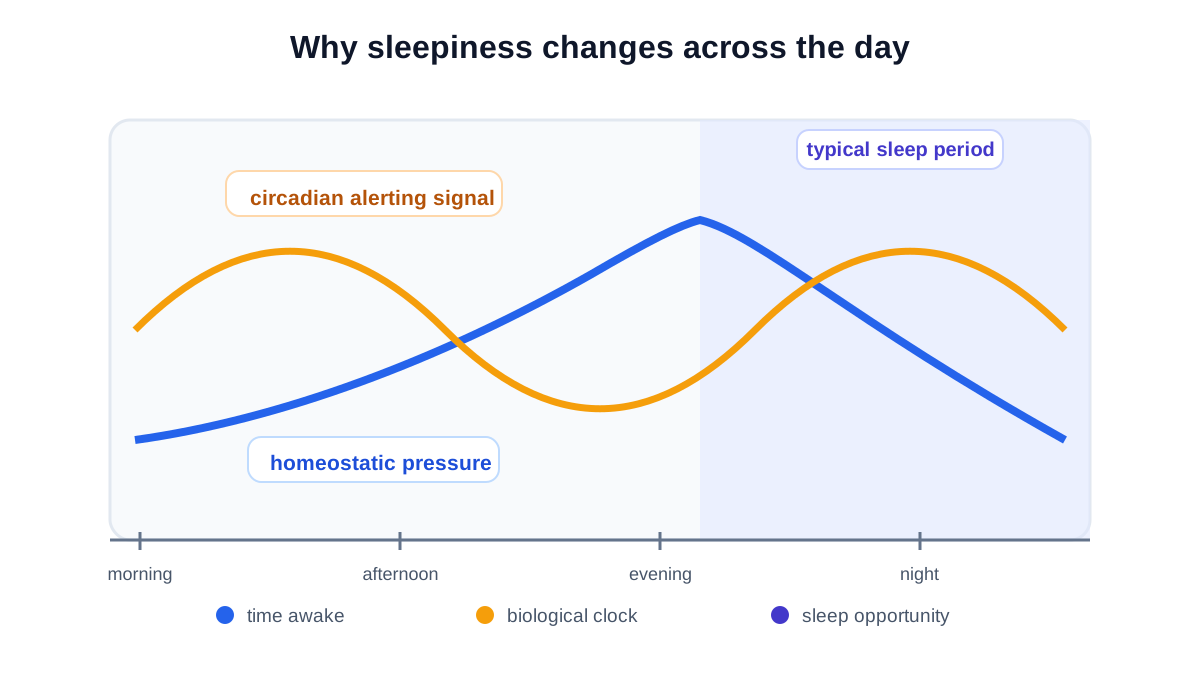
Circadian rhythm is an approximately daily timing system. Light information helps the suprachiasmatic nucleus align that rhythm with the environment, influencing melatonin timing and alertness. A separate homeostatic pressure rises with time awake and falls during sleep. Sleep onset becomes likely when circadian timing favors sleep and homeostatic pressure is high; neither process acts alone.

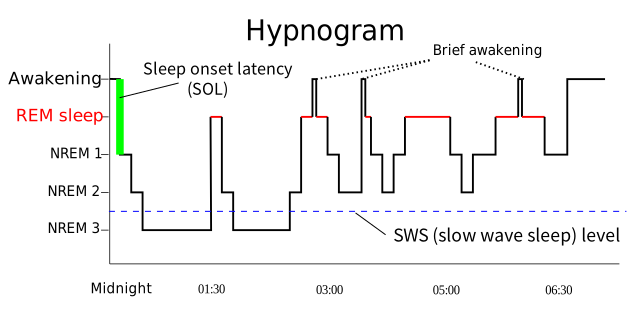
Sleep cycles through NREM and REM states identified by patterns in EEG, muscle tone, and eye movement. Deep slow-wave sleep is concentrated earlier in a typical night, while REM periods tend to lengthen later. The often-quoted 90-minute cycle is an average simplification, not a clock. Dreams can occur outside REM, and REM is not equivalent to deep sleep.

Sleep supports attention, memory, emotional regulation, and physical health, but a single correlational study cannot establish every causal pathway. Experimental deprivation can identify short-term performance effects; long-term health effects often depend on converging observational evidence. Insomnia, narcolepsy, and sleep apnea are distinct conditions described here only at recognition level, not for self-diagnosis.

Teaching figure
Two-process sleep diagram showing homeostatic pressure rising with time awake and circadian alerting changing across day and night

Sleep timing reflects two interacting processes

Sleep becomes more likely when homeostatic pressure is high and circadian alerting no longer strongly opposes it. Either process alone is incomplete.
Use this visual to see
Separate time-awake pressure from circadian timing and see why the same person can feel different at the same sleep pressure.
What it cannot show
One line rises through wakefulness and falls during sleep; a wave-like circadian signal changes across the day. Their interaction is conceptual rather than a clinical prediction.

Test Ninjas · Original educational diagram

Teaching figure
Hypnogram chart tracing wake, REM, and non-REM sleep stages across an eight-hour night

A night moves through recurring sleep stages

The trace descends into deeper NREM sleep and returns through lighter stages and REM several times. Deep sleep is concentrated earlier, while REM periods lengthen later; the exact pattern varies.

Use this visual to see
Read sleep as a changing sequence across a night instead of treating stages as an exact ninety-minute clock.
What it cannot show
Time runs from midnight to morning along the horizontal axis. The line repeatedly moves from wakefulness through lighter and deeper NREM stages, then back toward REM. The pictured sequence is illustrative, not a prediction for every sleeper or night.

RazerM and Wikimedia contributors · CC BY-SA / GFDL · Wikimedia Commons: Sleep Hypnogram

Read a night as a changing pattern

FeatureEarlier night tendencyLater night tendencyLimit
slow-wave NREMmore concentratedless concentratednot absent from every later cycle
REM durationshorter episodeslonger episodesindividual nights vary
homeostatic pressurefalls after sleep beginsgenerally lowercircadian timing still affects alertness
dream reportpossibleoften associated with REM awakeningdreaming is not exclusive to REM

Keep these three ideas

  • Circadian timing and homeostatic pressure jointly regulate sleep.
  • Stages are classified through physiological measurement.
  • Cycles and sleep needs vary; averages are not individual prescriptions.
1.6

Sensation

How is physical energy converted into neural information?

Short answer

Specialized receptors transduce light, pressure, chemicals, and bodily movement into neural activity whose detection depends on intensity, context, adaptation, and decision criterion.
Know firstNeural firing · Basic probability

Every modality begins with transduction

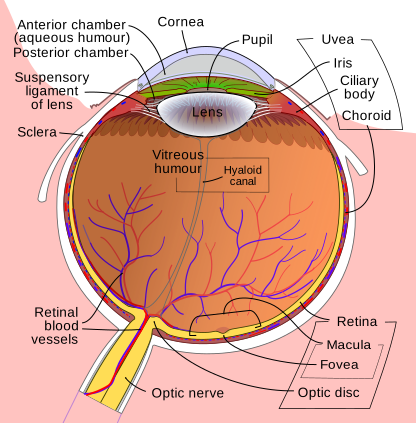
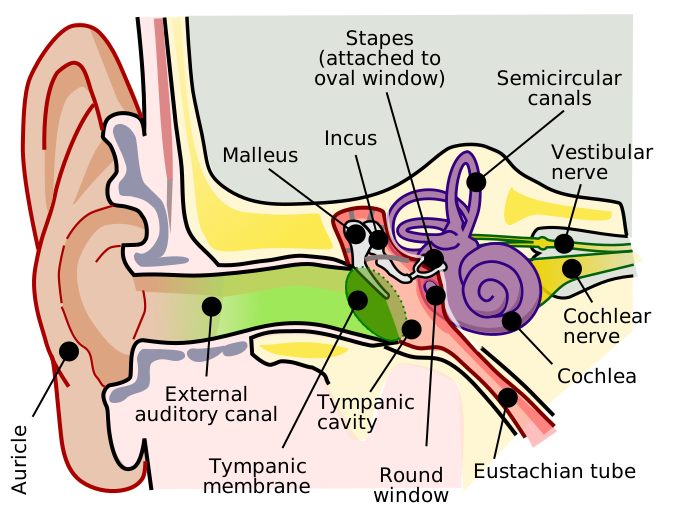
Sensation begins when a receptor converts physical or chemical energy into neural information. In vision, rods and cones in the retina respond to light before signals leave through the optic nerve. In hearing, pressure waves move structures in the cochlea and bend hair cells; place and temporal patterns help encode frequency. Taste and smell use chemical receptors. Touch, pain, vestibular sense, and proprioception detect mechanical, damaging, balance, or body-position information.

An absolute threshold is conventionally the intensity detected on about half of trials, not a fixed border. A difference threshold is the smallest detectable change under specified conditions; Weber’s law models it as a proportion of the starting intensity across a useful range. Sensory adaptation reduces responsiveness to steady input, allowing change to stand out, though dangerous or biologically important signals may remain salient.

Signal detection theory separates sensory sensitivity from response criterion. A faint signal can produce a hit, miss, false alarm, or correct rejection depending on both internal evidence and the observer’s decision rule. Motivation, expectation, fatigue, and costs can shift criterion without changing receptors. Sensation supplies encoded input; perception organizes and interprets it.

Teaching figure
Detailed color cross-section of the human eye labeling the cornea, iris, pupil, lens, retina, fovea, blind spot, and optic nerve

The eye focuses light onto the retina

Light is focused by the cornea and lens before reaching rods and cones in the retina. Signals then leave through the optic nerve; the diagram stops before cortical perception.
Use this visual to see
Follow light to the retina and locate transduction within the larger visual pathway.
What it cannot show
A cutaway eye shows incoming light passing the cornea, pupil, and lens to reach the retina at the back. The fovea is a specialized retinal region, while the optic disc creates a blind spot where nerve fibers exit.

Rhcastilhos; English labels by Jmarchn · CC BY-SA 3.0 · Wikimedia Commons: human eye schematic

Teaching figure
Detailed color diagram labeling the outer, middle, and inner ear, including the ossicles, semicircular canals, cochlea, and auditory nerve

Sound is conducted before it is transduced

The outer and middle ear conduct pressure changes to the inner ear. Motion in the cochlea bends hair cells, converting mechanical energy into neural signals carried by the auditory nerve.

Use this visual to see
Separate sound conduction from sensory transduction and locate the cochlea within the full auditory pathway.
What it cannot show
The diagram follows sound from the ear canal across the eardrum and three middle-ear bones to the fluid-filled cochlea. The semicircular canals sit beside the cochlea but primarily support balance rather than hearing.

L. Chittka and A. Brockmann · CC BY 2.5 · Wikimedia Commons: Anatomy of the Human Ear

From energy to neural code

ModalityPhysical inputReceptor siteImportant boundary
visionlight wavelength and intensityretinal rods and conesretina transduces; brain constructs perception
hearingair-pressure frequency and amplitudecochlear hair cellsfrequency is not loudness
taste and smelldissolved or airborne chemicalschemoreceptorsflavor is multisensory
vestibular sensehead motion and orientationinner-ear organsdistinct from hearing
proprioceptionmuscle and joint statereceptors across the bodynot part of a five-senses-only list

Keep these three ideas

  • Transduction converts physical or chemical input into neural signals.
  • Thresholds summarize probabilities and context.
  • Signal detection separates sensitivity from decision criterion.

Biological Bases of Behavior review

Biology constrains behavior without determining it alone: signals move through nested systems whose operation changes with development, context, experience, and measurement method.

Recognize immediately

  • Trace afferent input toward the CNS and efferent output toward effectors.
  • Separate observed neural or behavioral data from a causal interpretation.
  • State the population and environment before interpreting heritability.
  • Connect each sensory modality to its receptor and transduced energy.

Practice AP Psychology in the real test engine.

Free practice set: timed, the same engine as our full-length tests, every answer explained.