Supply and Demand
Demand and supply schedules meet at equilibrium; elasticities measure responsiveness, while policy and trade create wedges that change quantities and the distribution of surplus.
- Exam weight
- 20–25%
- Topics
- 9
Introduction
Demand and supply schedules meet at equilibrium; elasticities measure responsiveness, while policy and trade create wedges that change quantities and the distribution of surplus.
Start every graph by naming the vertical price per unit, horizontal quantity per period, and variables held constant. An own-price change causes movement along a curve. A non-axis determinant shifts a schedule, and the new intersection determines the modeled price and quantity.
Surplus measures gains from exchange under stated assumptions. Price controls, taxes, subsidies, tariffs, and quotas redistribute some surplus and may prevent mutually beneficial trades, but efficiency accounting alone does not answer equity, rights, enforcement, or strategic-policy questions.
schedules, determinants, and equilibrium
percentage responsiveness and incidence
buyer value, seller cost, and gains from trade
wedges, transfers, revenue, and deadweight loss
Demand
When does buyer behavior move along a demand curve, and when does it shift the curve?
A change in the good’s own price changes quantity demanded on the existing curve; a change in income, tastes, expectations, related-good prices, or buyer count shifts demand.
A demand schedule and a buyer-count shift
Place own price on the axis and buyer count outside the curve.
- Held constant
- All nonprice determinants are constant on each curve; the added buyer contributes three units at every displayed price.
- Time horizon
- One weekly market period with other demand determinants fixed.
- Read the change
- An own-price change moves along one demand curve. Adding a buyer shifts every coordinate right from D0 to D1.
- Movement: price
- 12 → 9
- Movement: quantity
- 3 → 6
- Added demand
- +3 at each price
- Horizontal axis
- Quantity demanded (units per week)
- Vertical axis
- Price (currency per unit)
- Price 12 to 9 is movement along D0.
- Buyer count shifts the entire schedule.
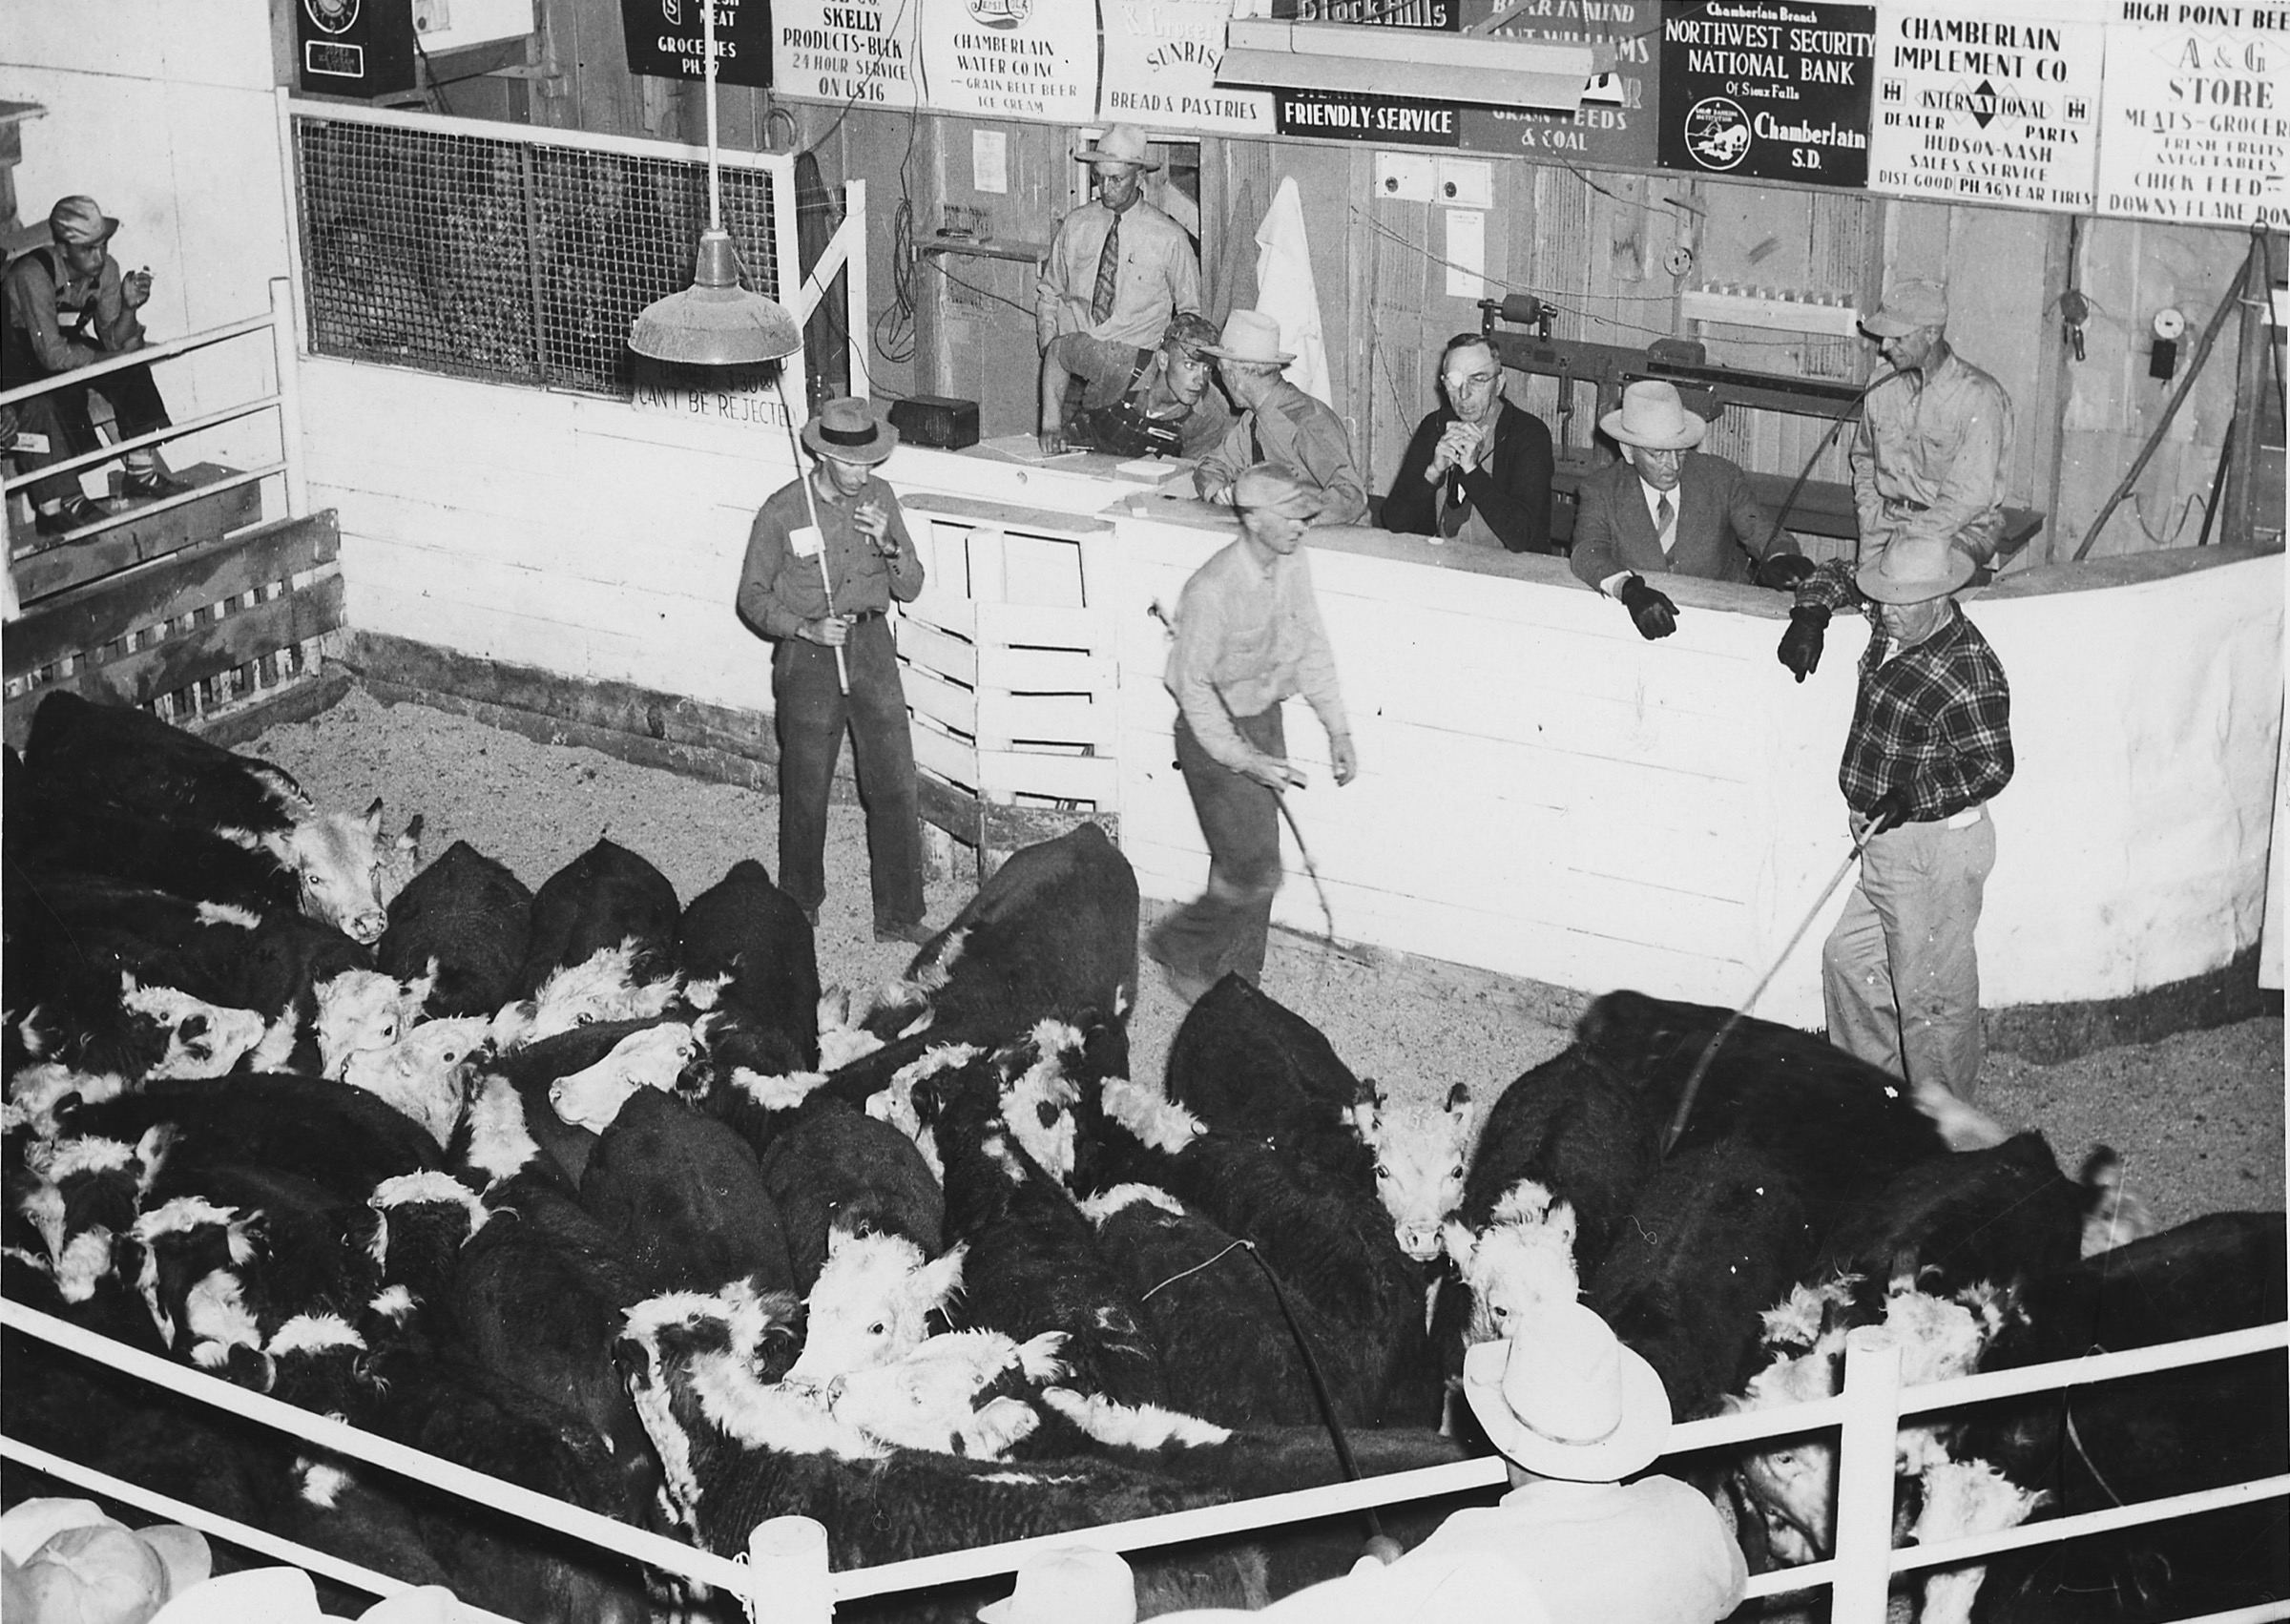
Demand combines many buyers at each possible price
An auction makes willingness to pay visible as buyers respond to successive prices. A market demand curve goes further: it totals how many units all buyers would purchase at every price, holding demand determinants fixed.